Soqit
Selected work
Every asset, in real time.
An asset intelligence platform: live telemetry, a signals engine, and fleet operations, built multi-tenant. We design and build it end to end.
Built by Pivot & Anchor, a small product studio.- Role
- Design & Engineering
- Client
- Under NDA
- Platform
- Web
- Category
- Asset intelligence / fleet operations
- Stack
- Next.js, Fastify, Postgres, TimescaleDB
- Status
- In active development
Soqit is an asset intelligence platform. It takes a live stream of telemetry off vehicles and field equipment, turns it into a map you can read at a glance, and watches it for the things an operator actually cares about: a vehicle leaving its zone, a sensor crossing a threshold, a trip running late. Fleets, drivers, trips, maintenance, and reporting all live in the same place.
It runs as one platform with two faces. Each customer gets their own tenant: a product UI scoped to their assets, their rules, their people. Behind that sits an admin console where the platform team manages tenants, entitlements, and audit. The brief was to build both, multi-tenant from the first table, so a second customer is a row in the database and not a fork of the codebase.
We design and build it end to end, from the telemetry ingest to the last chart on the dashboard. It is in active development, shipping toward its first production tenants.
Inside the platform

01 — Overview
The tenant's command centre
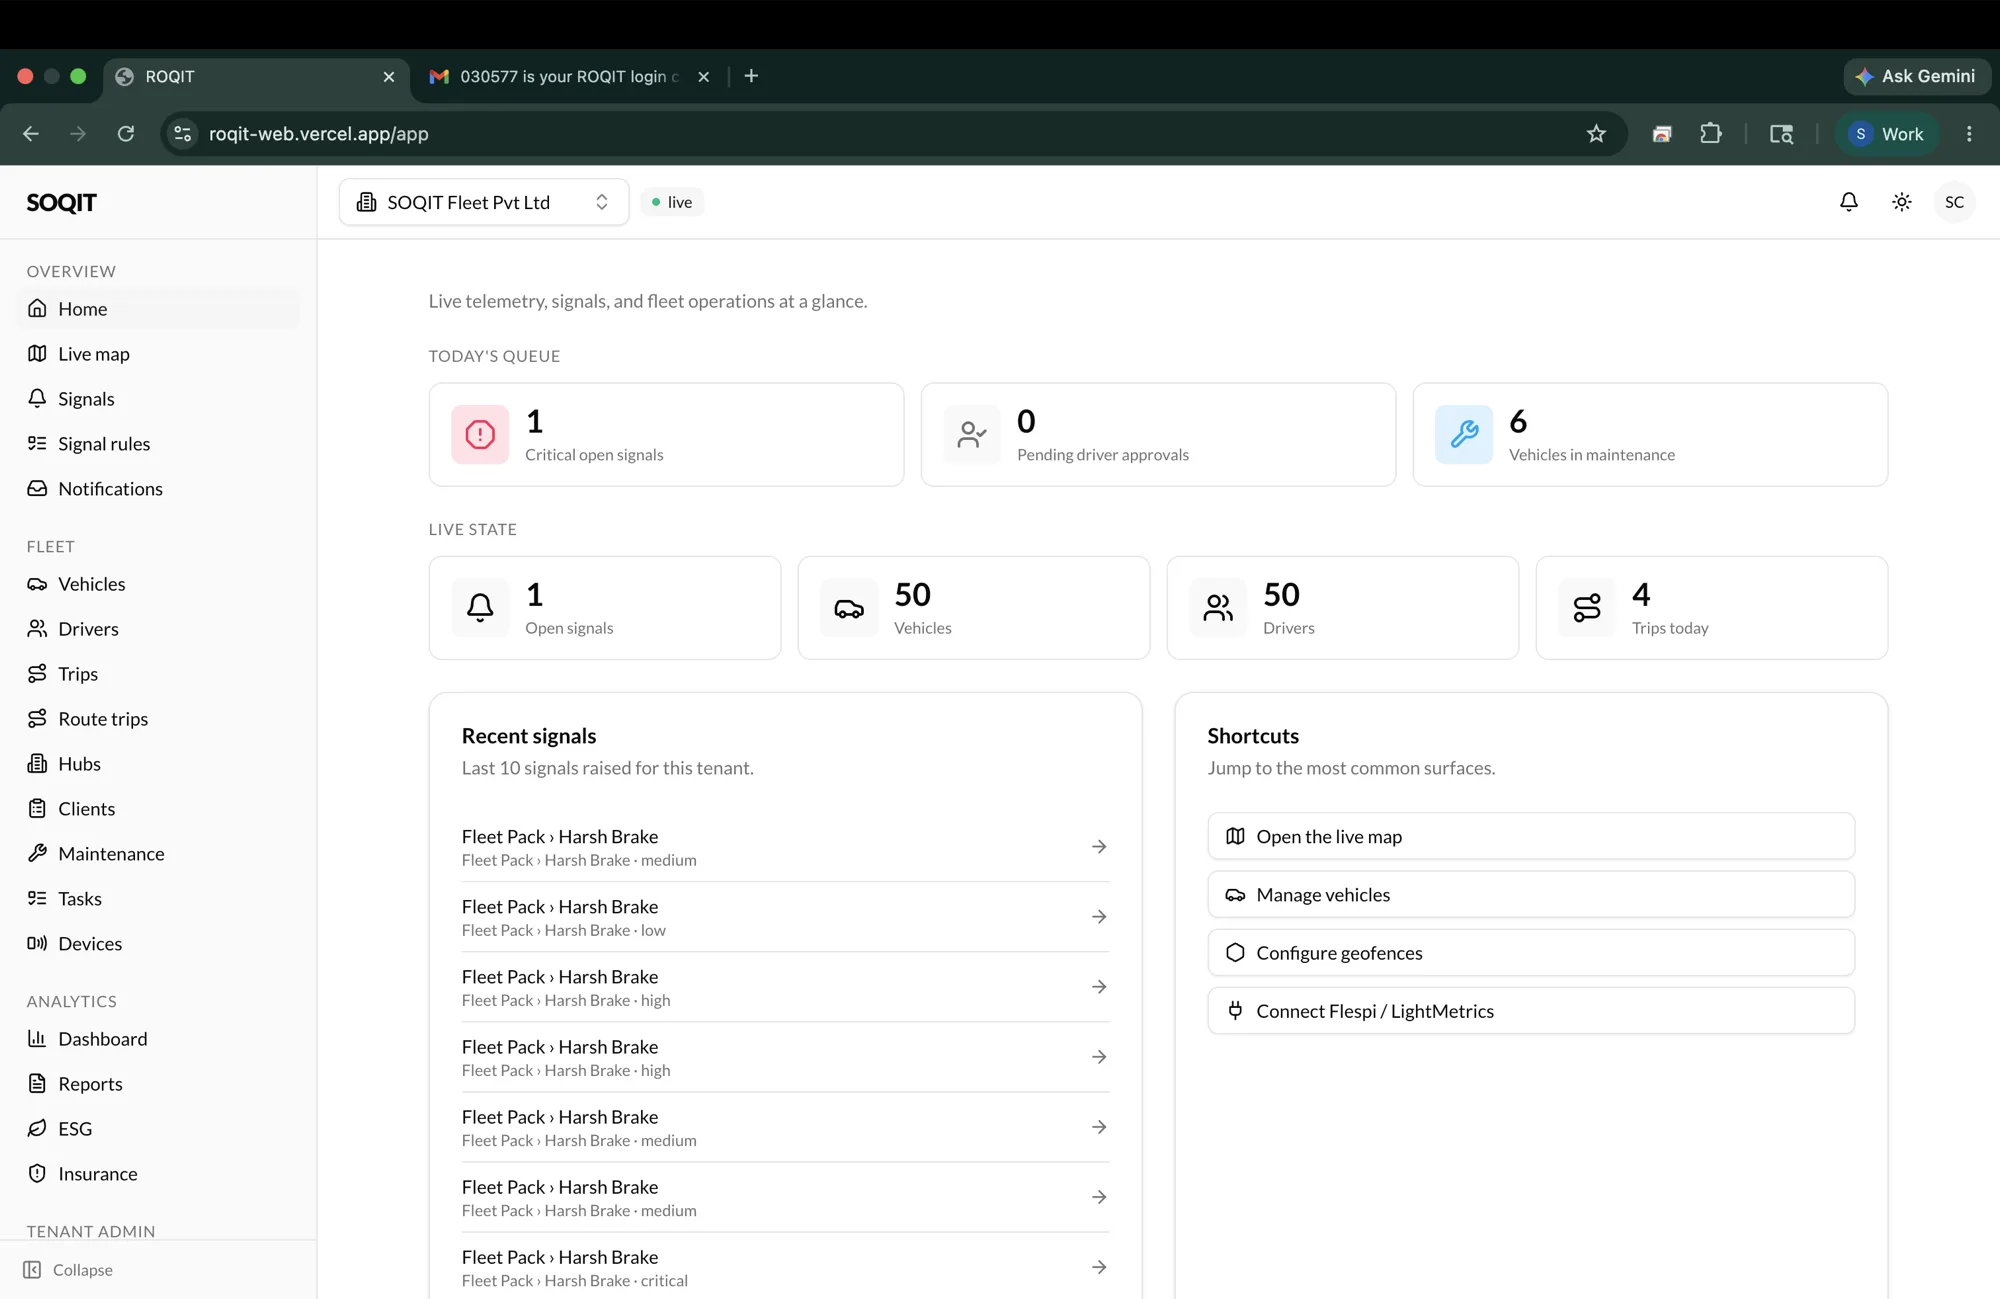
Each customer signs into their own tenant, and it opens on the day at a glance. Today's queue of critical signals, the live count of open alerts, vehicles, drivers, and trips, and a feed of the last signals the rules raised. Shortcuts drop you into the surfaces you reach for most, so the platform starts with what needs attention, not an empty home.
02 — Signals
A live inbox of everything raised
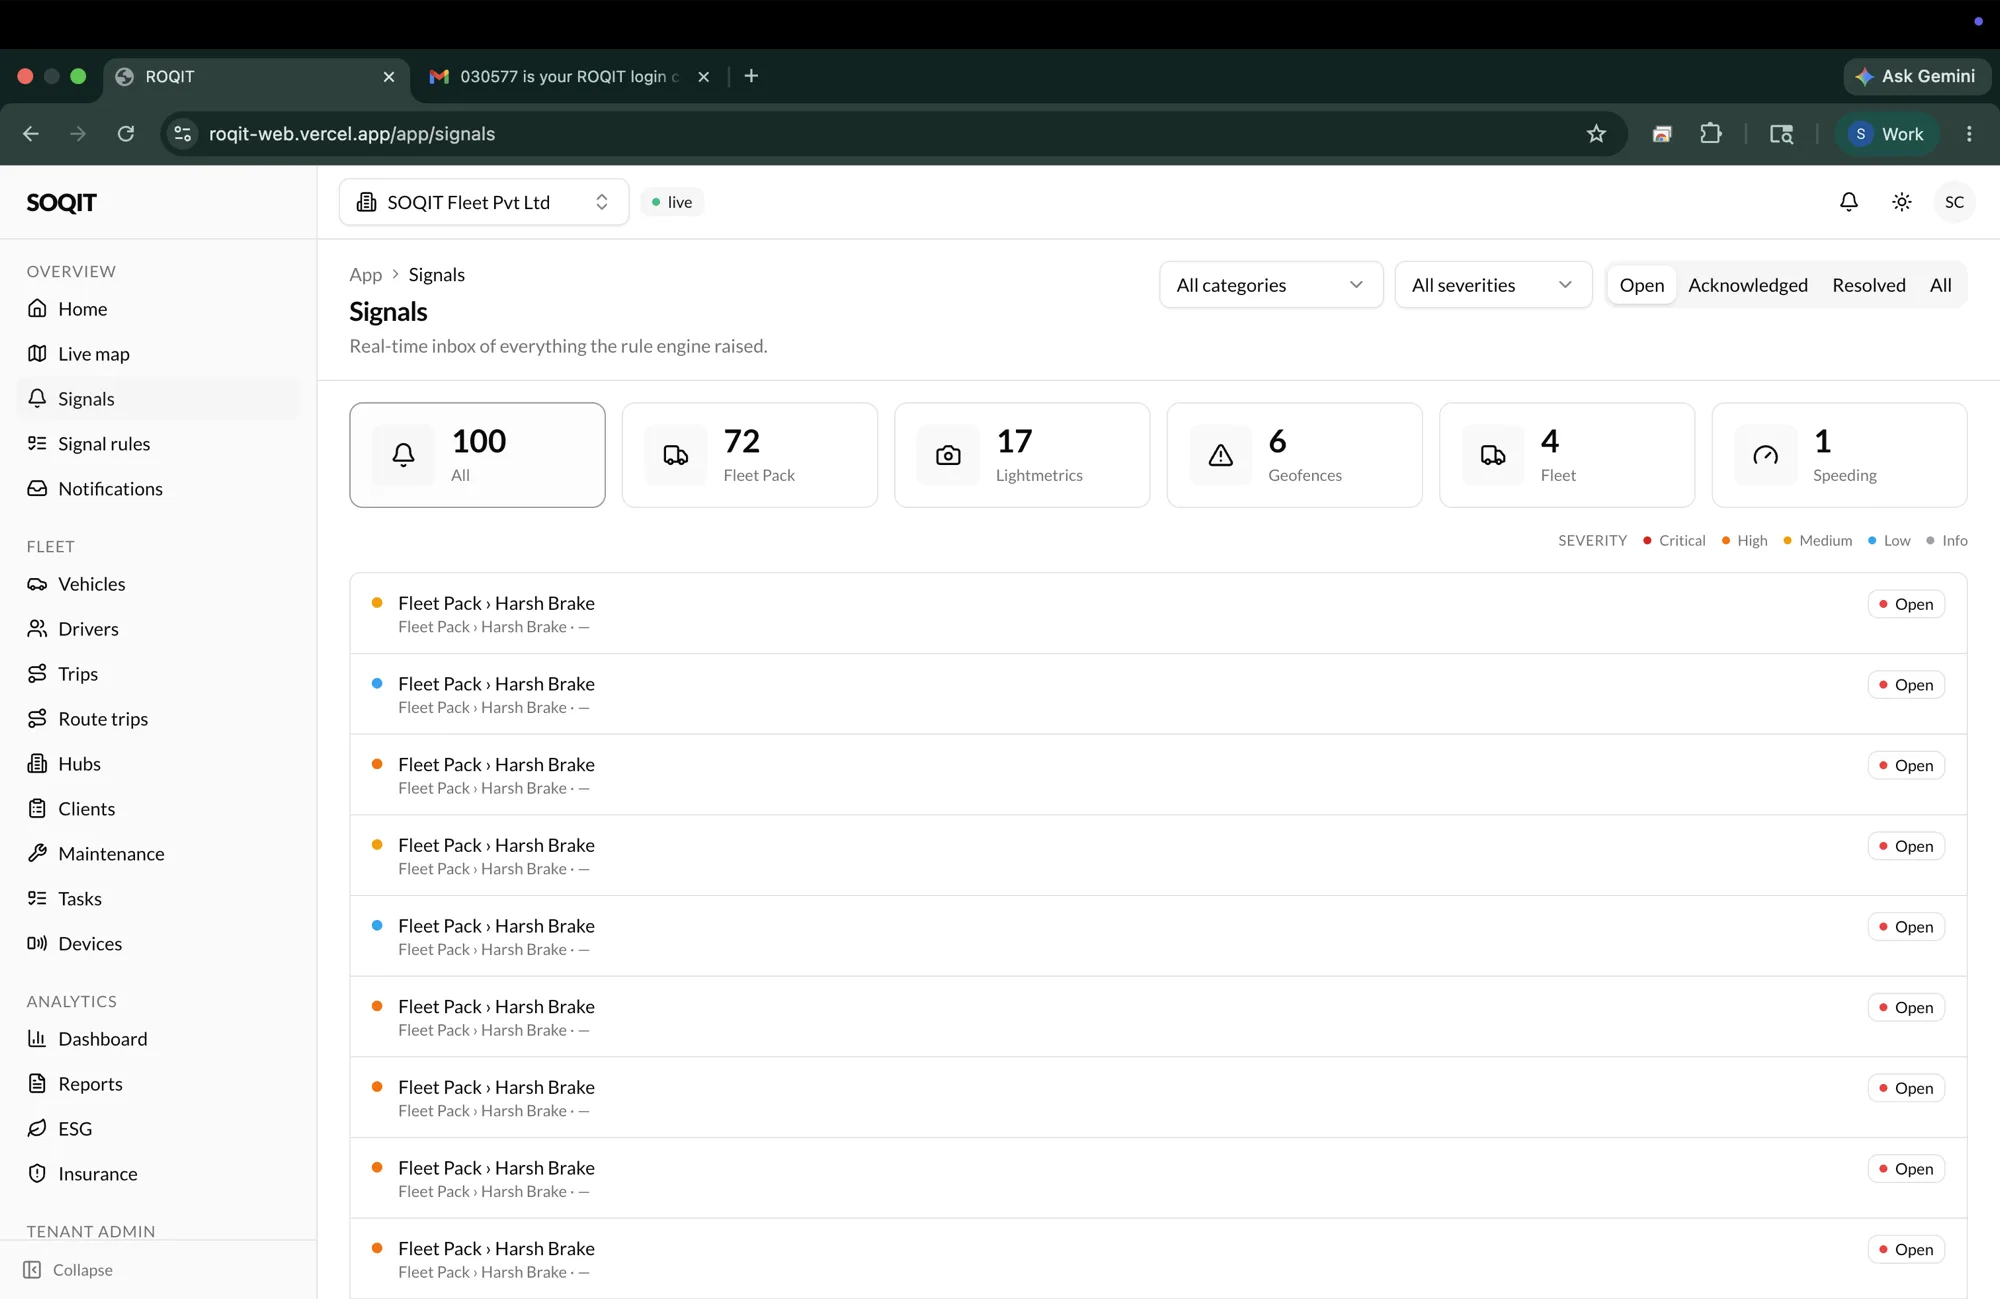
Signals is the real-time inbox of every event the rules engine fires. Filter by category, by severity from critical down to info, and by open, acknowledged, or resolved. The stream stays current as telemetry lands, so an operator works one prioritised queue instead of watching a map and hoping to catch the moment something goes wrong.
03 — Signal rules
Telemetry becomes alerts
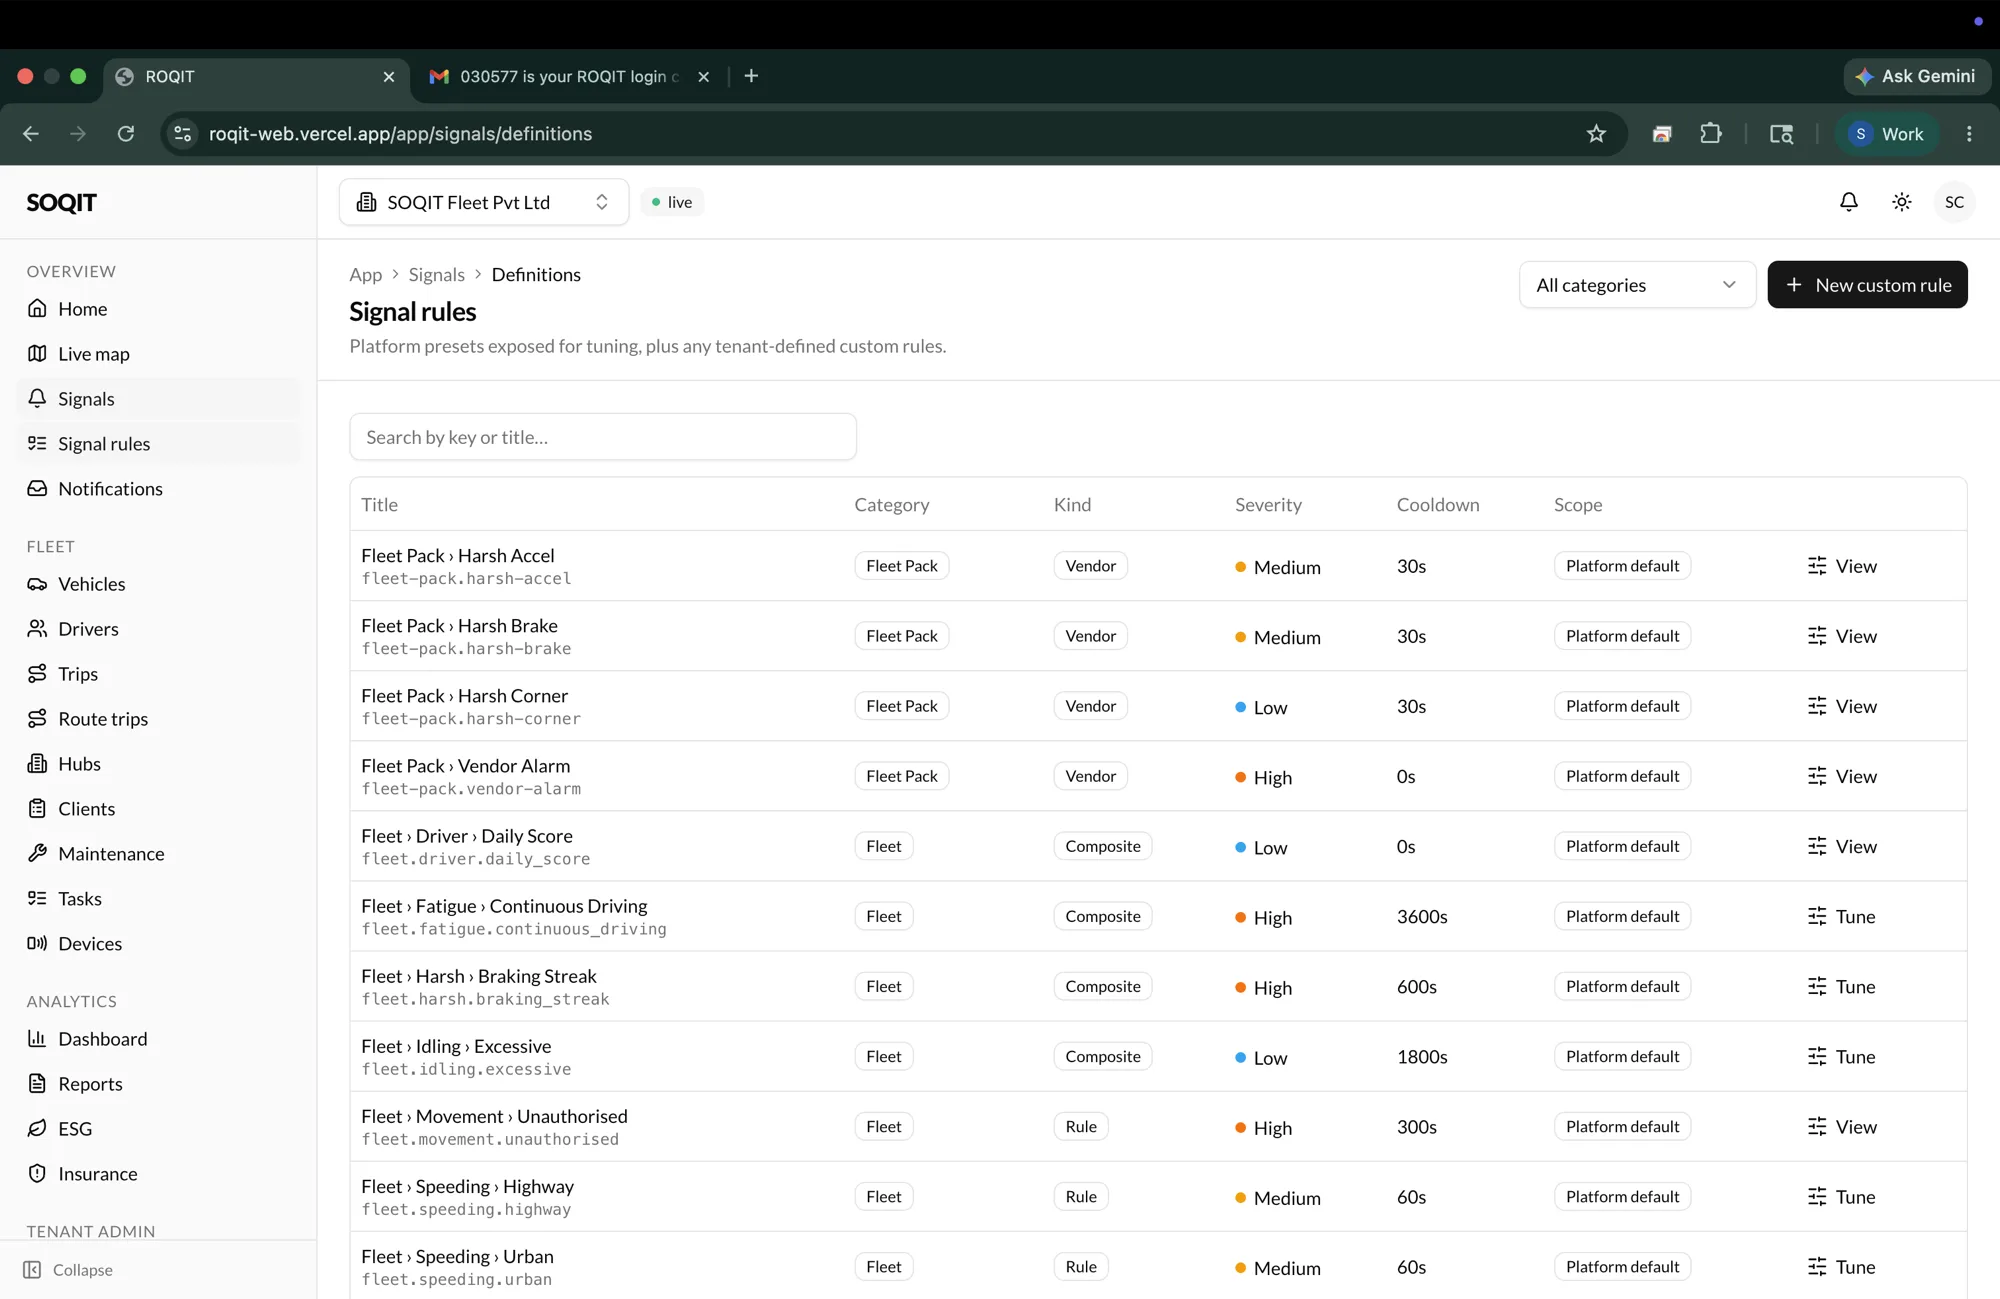
The rules engine turns the raw stream into the signals worth seeing. The platform ships presets for the common cases, and each tenant tunes the severity, the cooldown, and the scope without touching code, or writes its own. A hard threshold, a composite pattern over a window, a geofence breach, all declared as configuration.
04 — Vehicles
Every asset under management
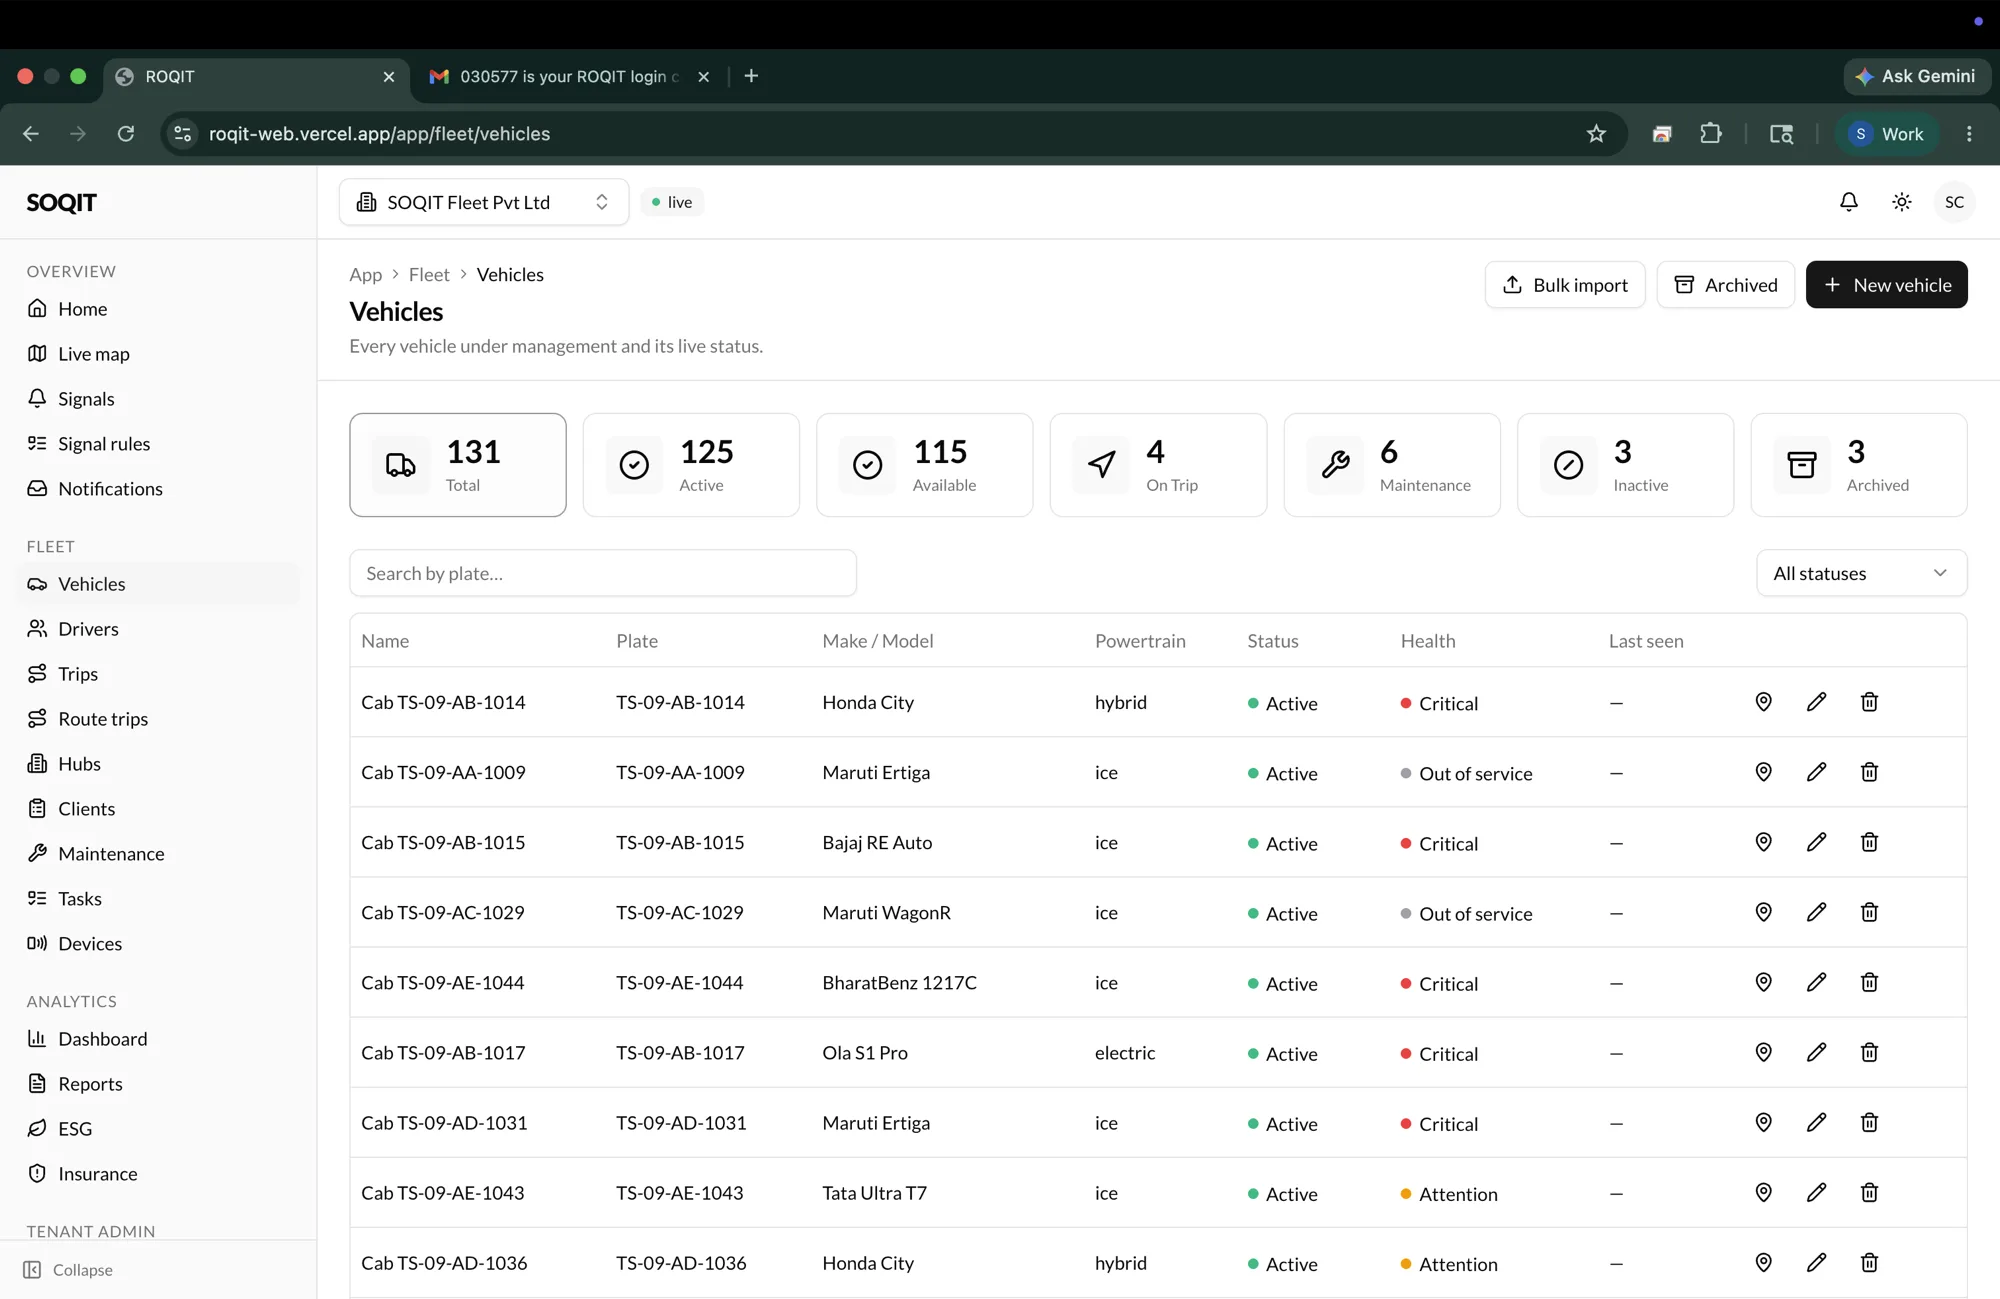
The fleet starts with the vehicles. Each carries its plate, make and model, powertrain, status, and a health read, with a last-seen timestamp so a silent asset stands out. Totals across active, available, on-trip, in maintenance, and archived sit up top, so the size and state of the fleet read in a glance.
05 — Drivers
Licences, scores, and standing
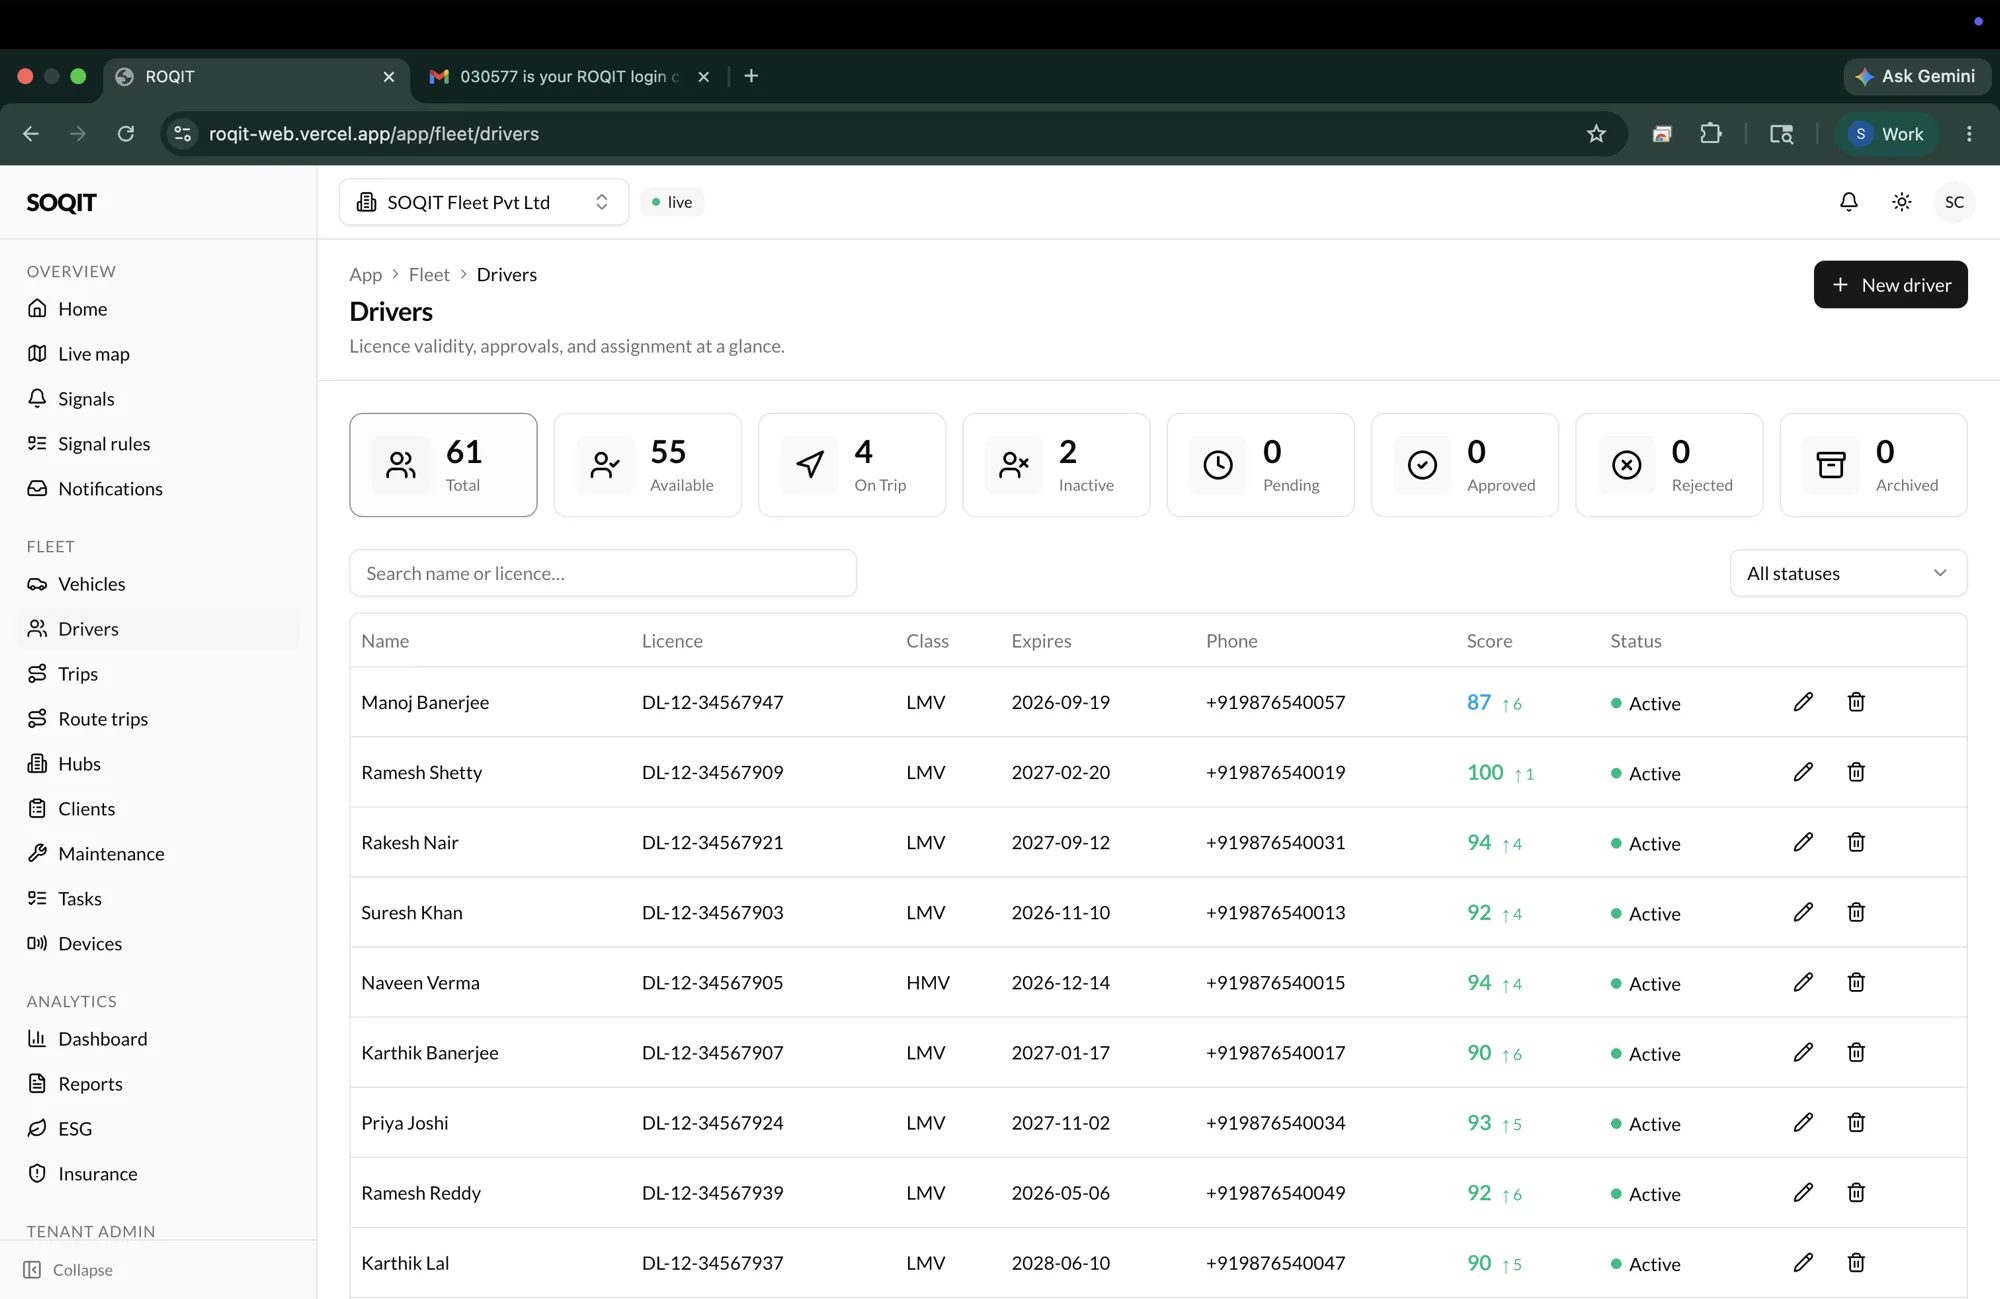
Drivers live alongside the vehicles, with licence class, validity, and expiry, and a score derived from how they actually drive. Approvals and assignment are tracked here, so a licence about to lapse or a driver who needs review is something the operator sees before it becomes a problem on the road.
06 — Trips
Every drive, rolled up
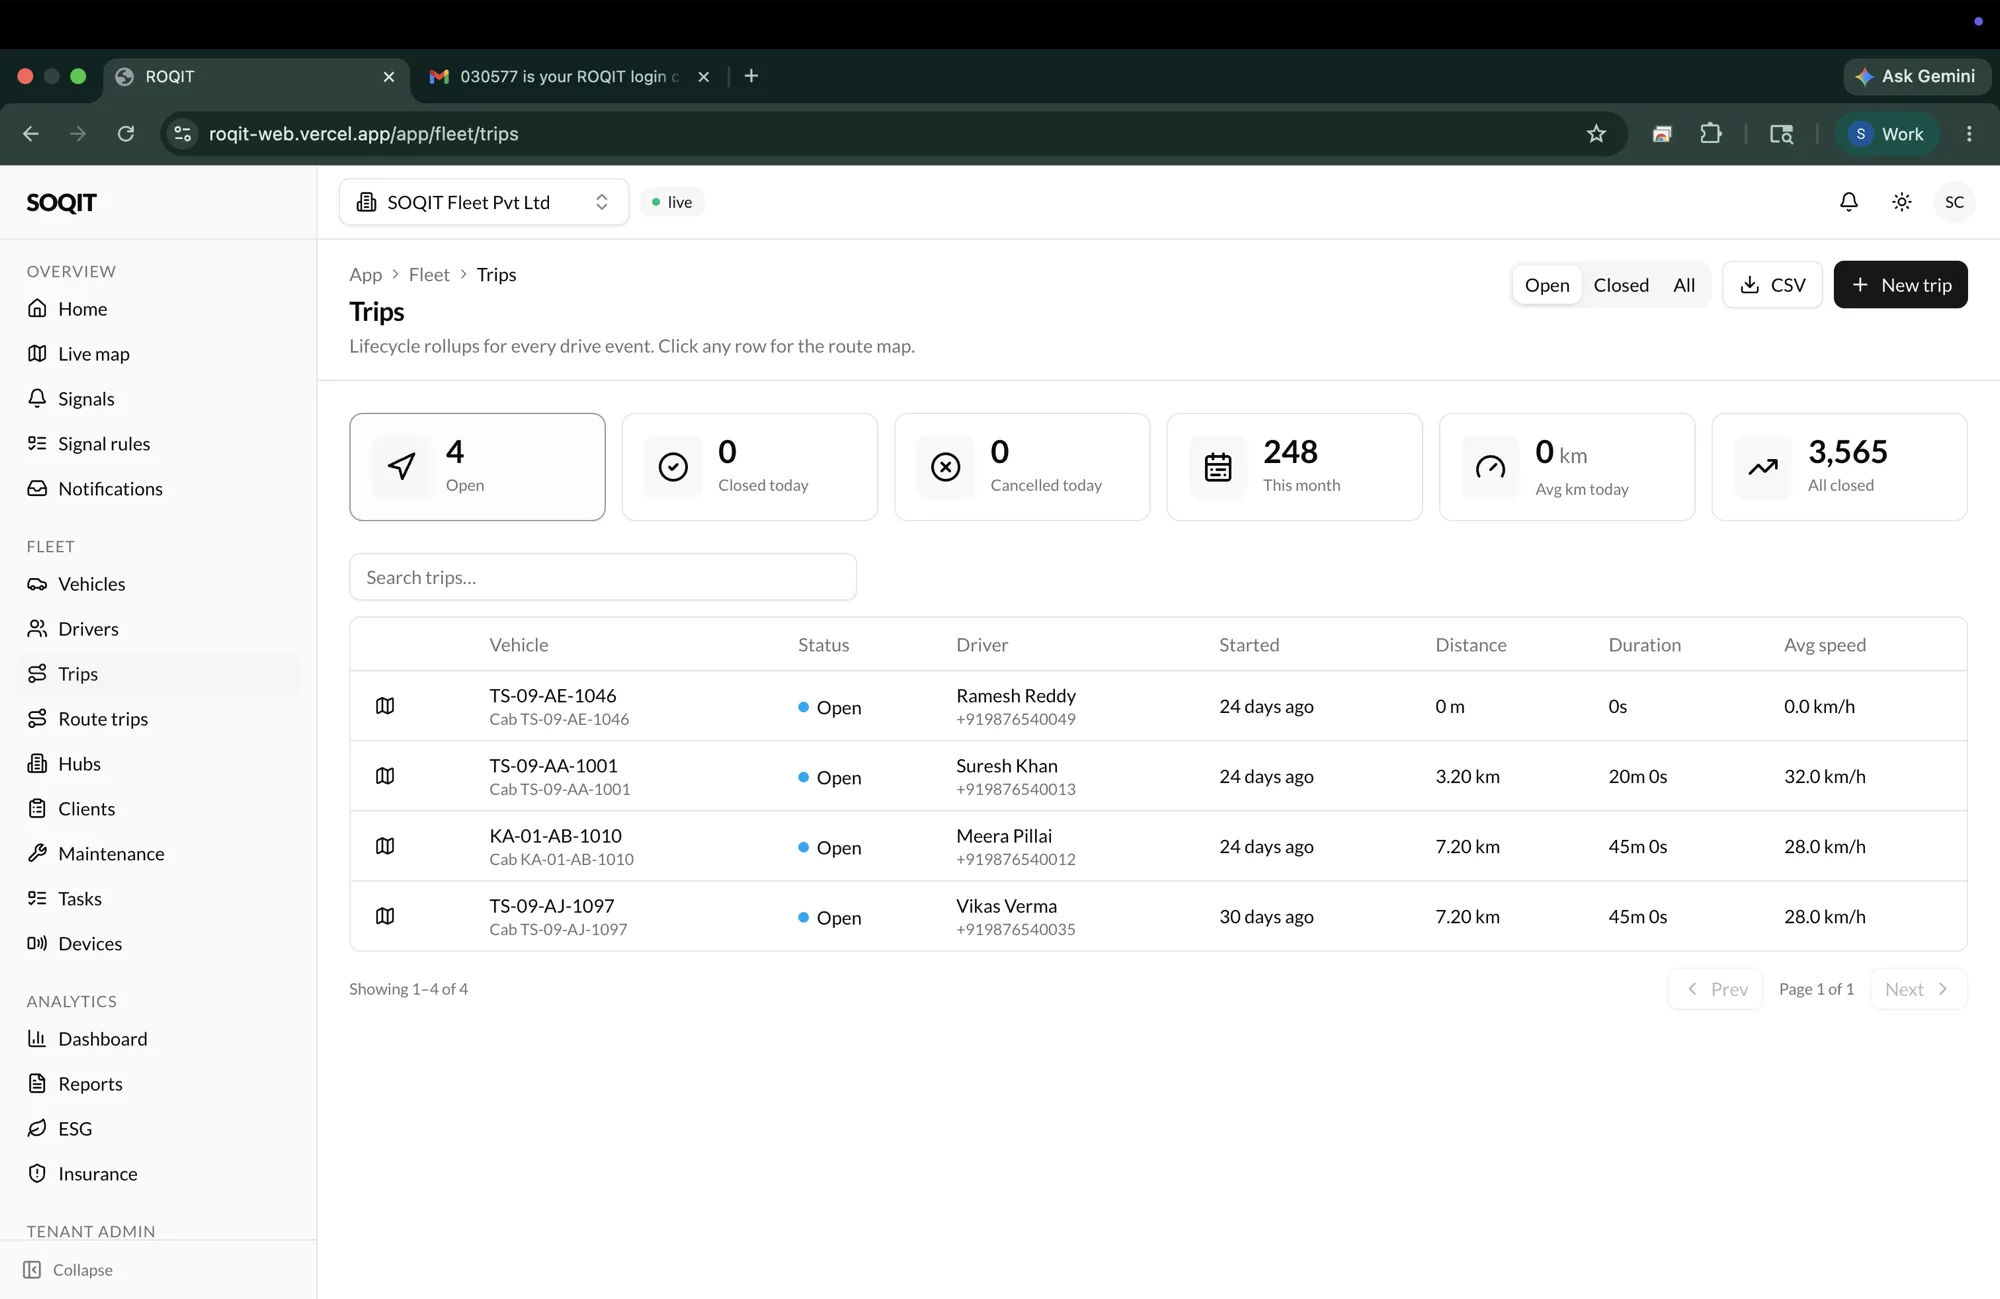
Trips are the lifecycle of every drive event. Distance, duration, and average speed roll up per trip, linked to the vehicle and driver that ran it, and any row opens to the route on the map. Open, closed today, cancelled, and the month's totals give the day's movement a shape without opening a single trip.
07 — Route trips
Multi-stop, suspend and resume
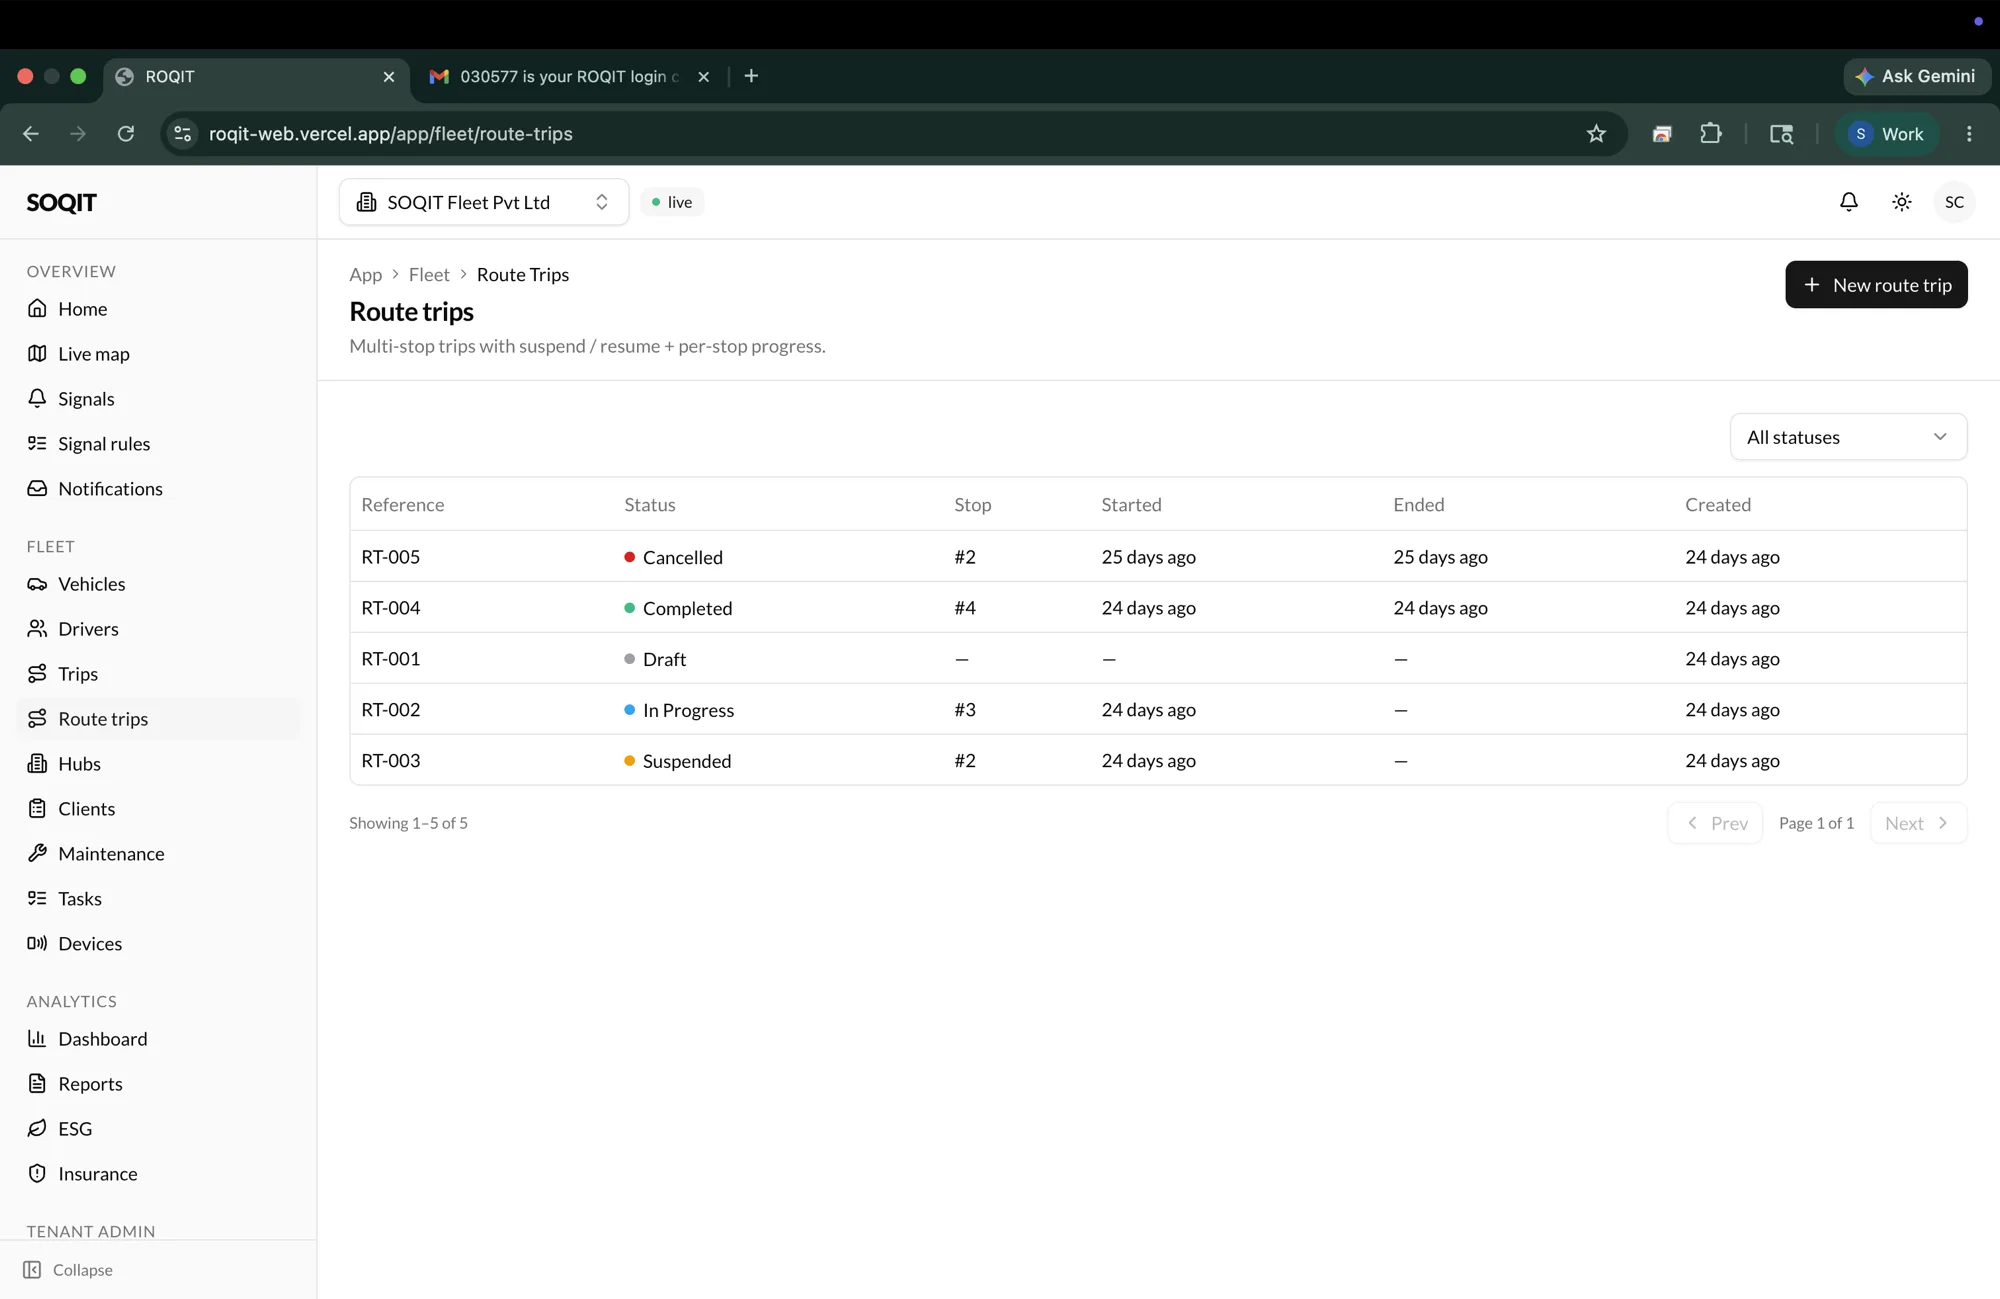
Some journeys are not one leg but many. Route trips model multi-stop runs with per-stop progress and the ability to suspend and resume, so a route that pauses for the night picks up exactly where it left off. Draft, in progress, suspended, completed, or cancelled, each stop accounted for.
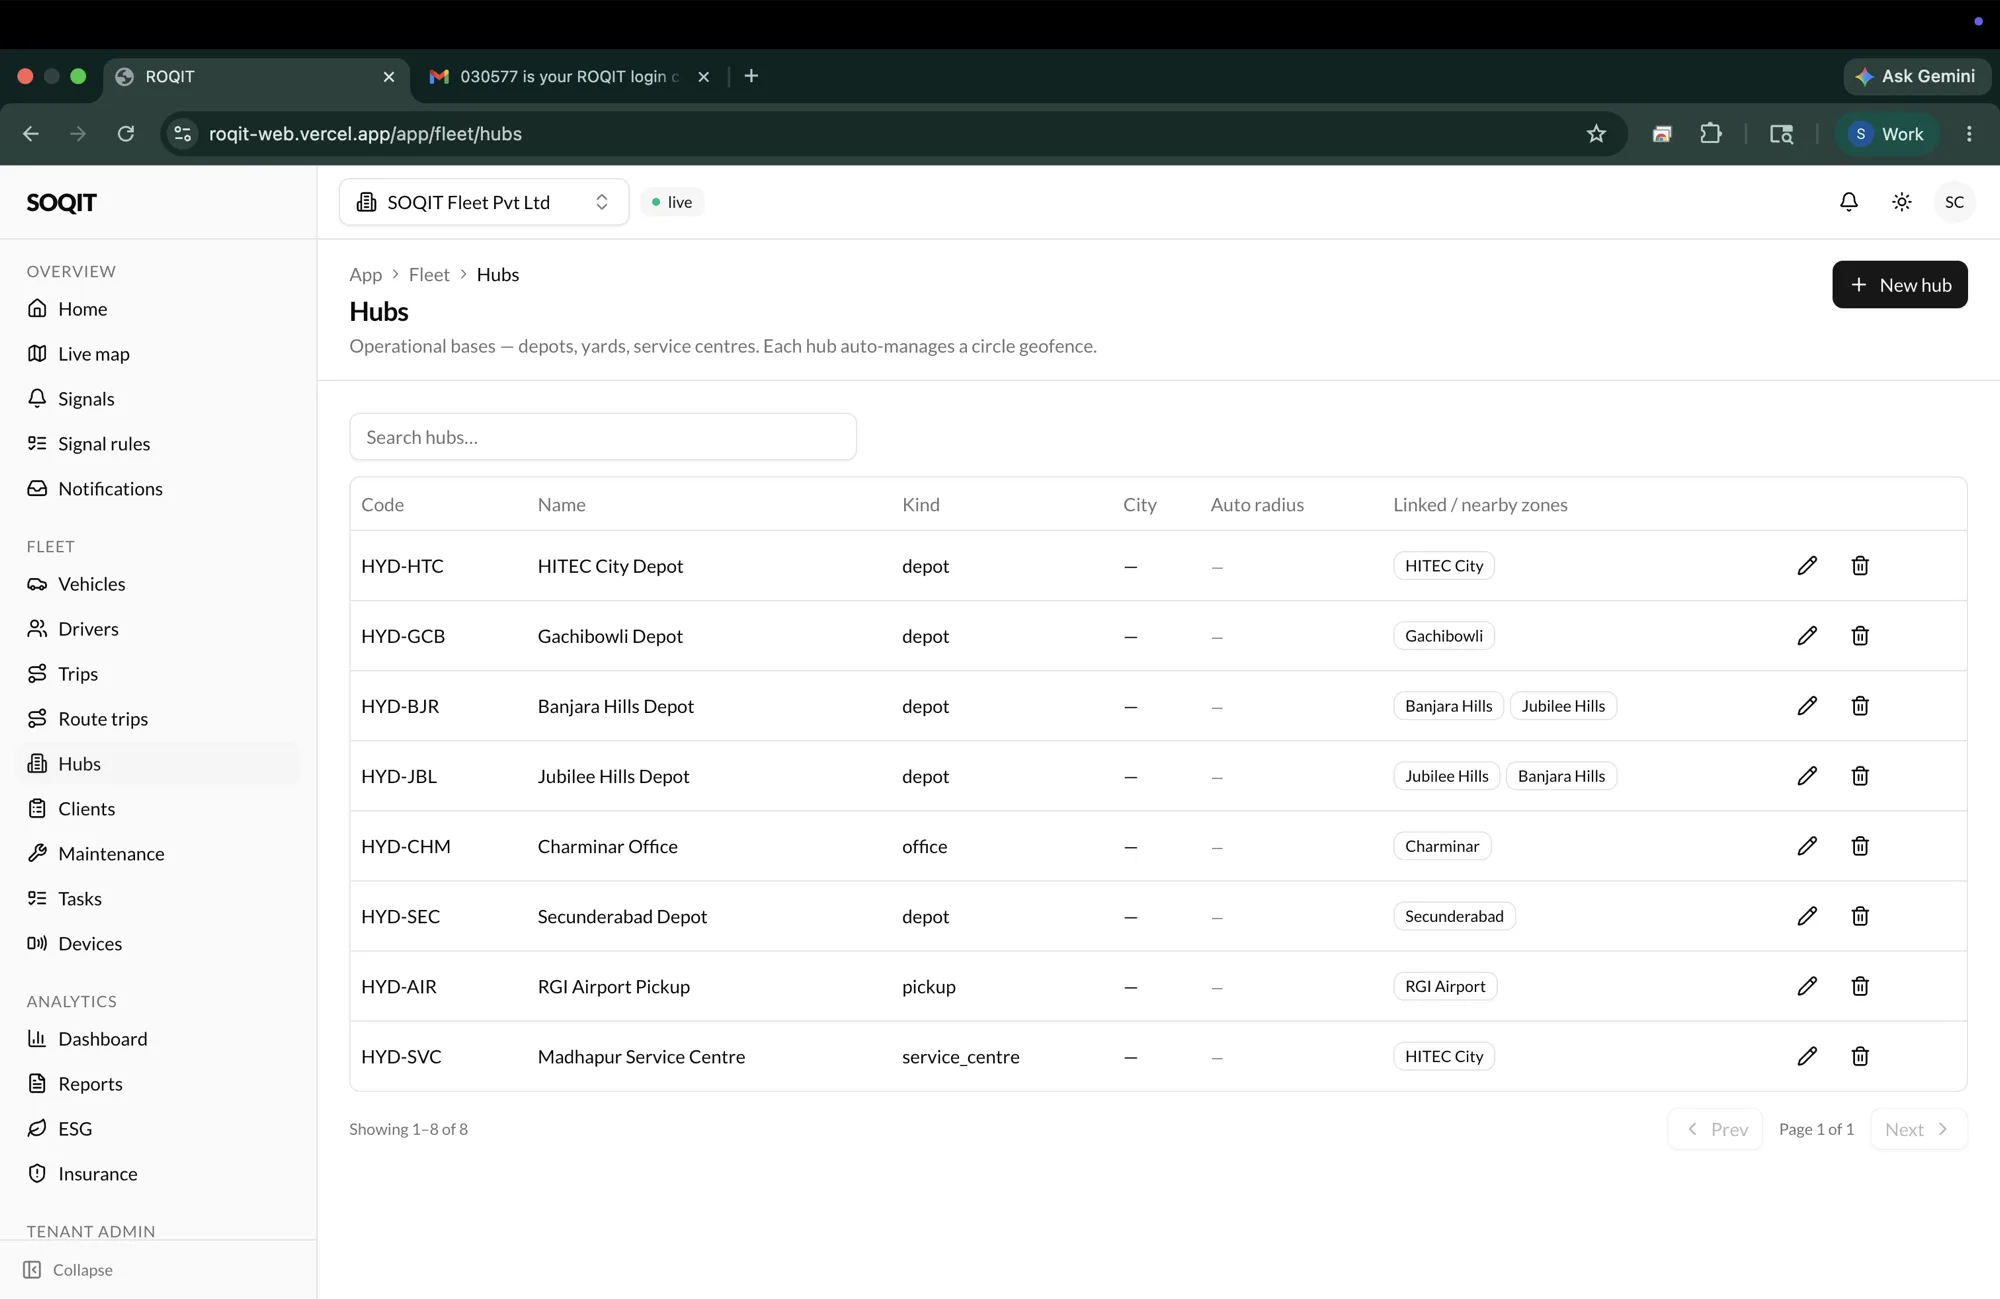
08 — Hubs
The places the fleet runs from
Hubs are the operational bases: depots, yards, service centres, and pickup points. Each one auto-manages a circle geofence around itself, so arrivals and departures become signals without anyone drawing a fence by hand. The physical footprint of the operation, modelled once and reused everywhere geofencing matters.
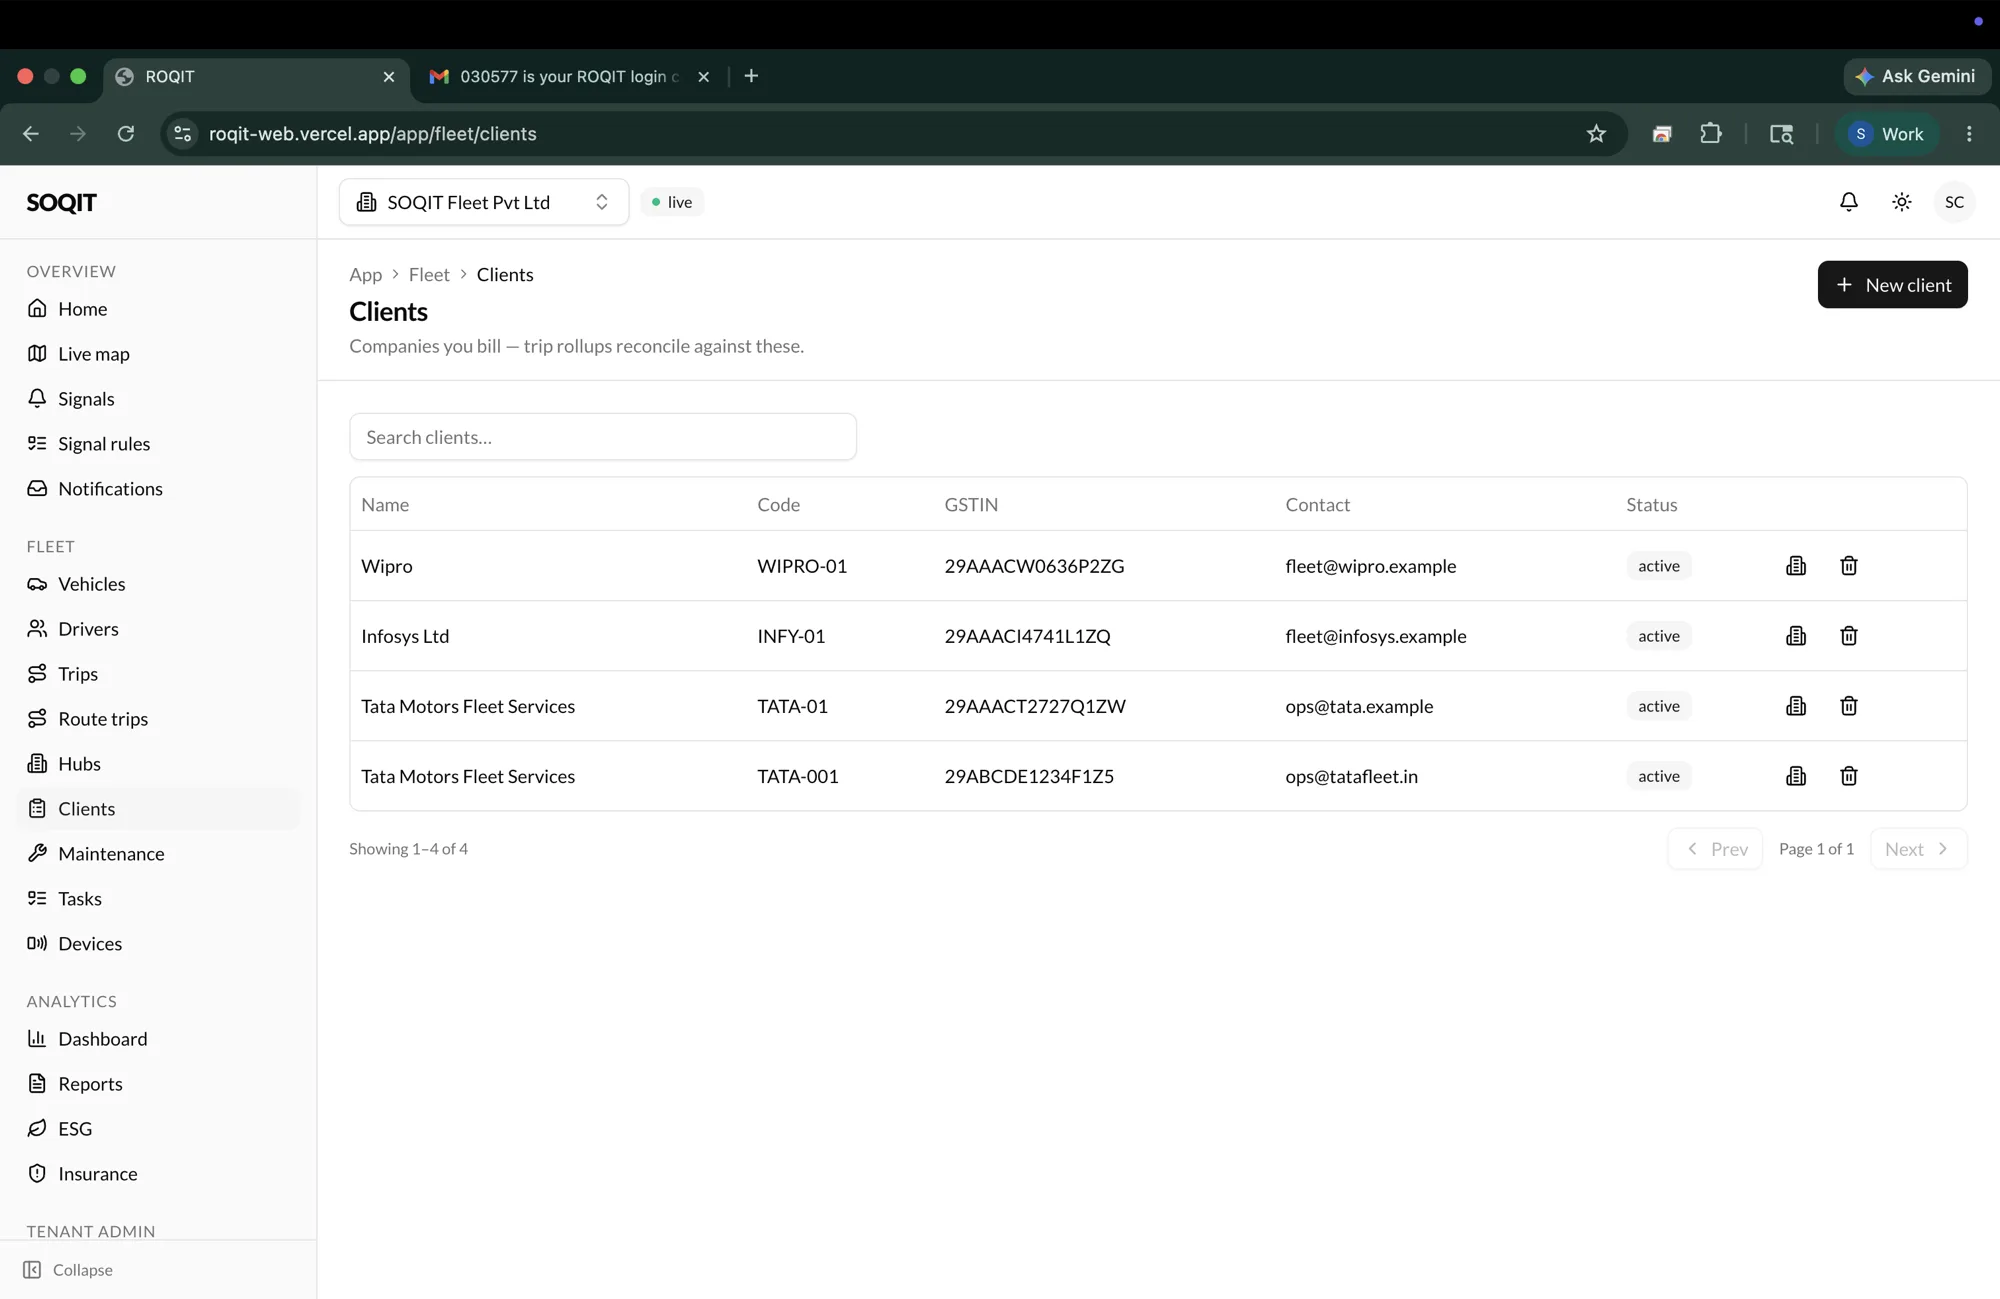
09 — Clients
Who the trips bill back to
For fleets that run on behalf of others, clients are the companies the work bills to, and trip rollups reconcile against them. Each carries its billing code, tax identifier, and contact, so the operational record and the commercial one stay tied together instead of living in a separate spreadsheet.
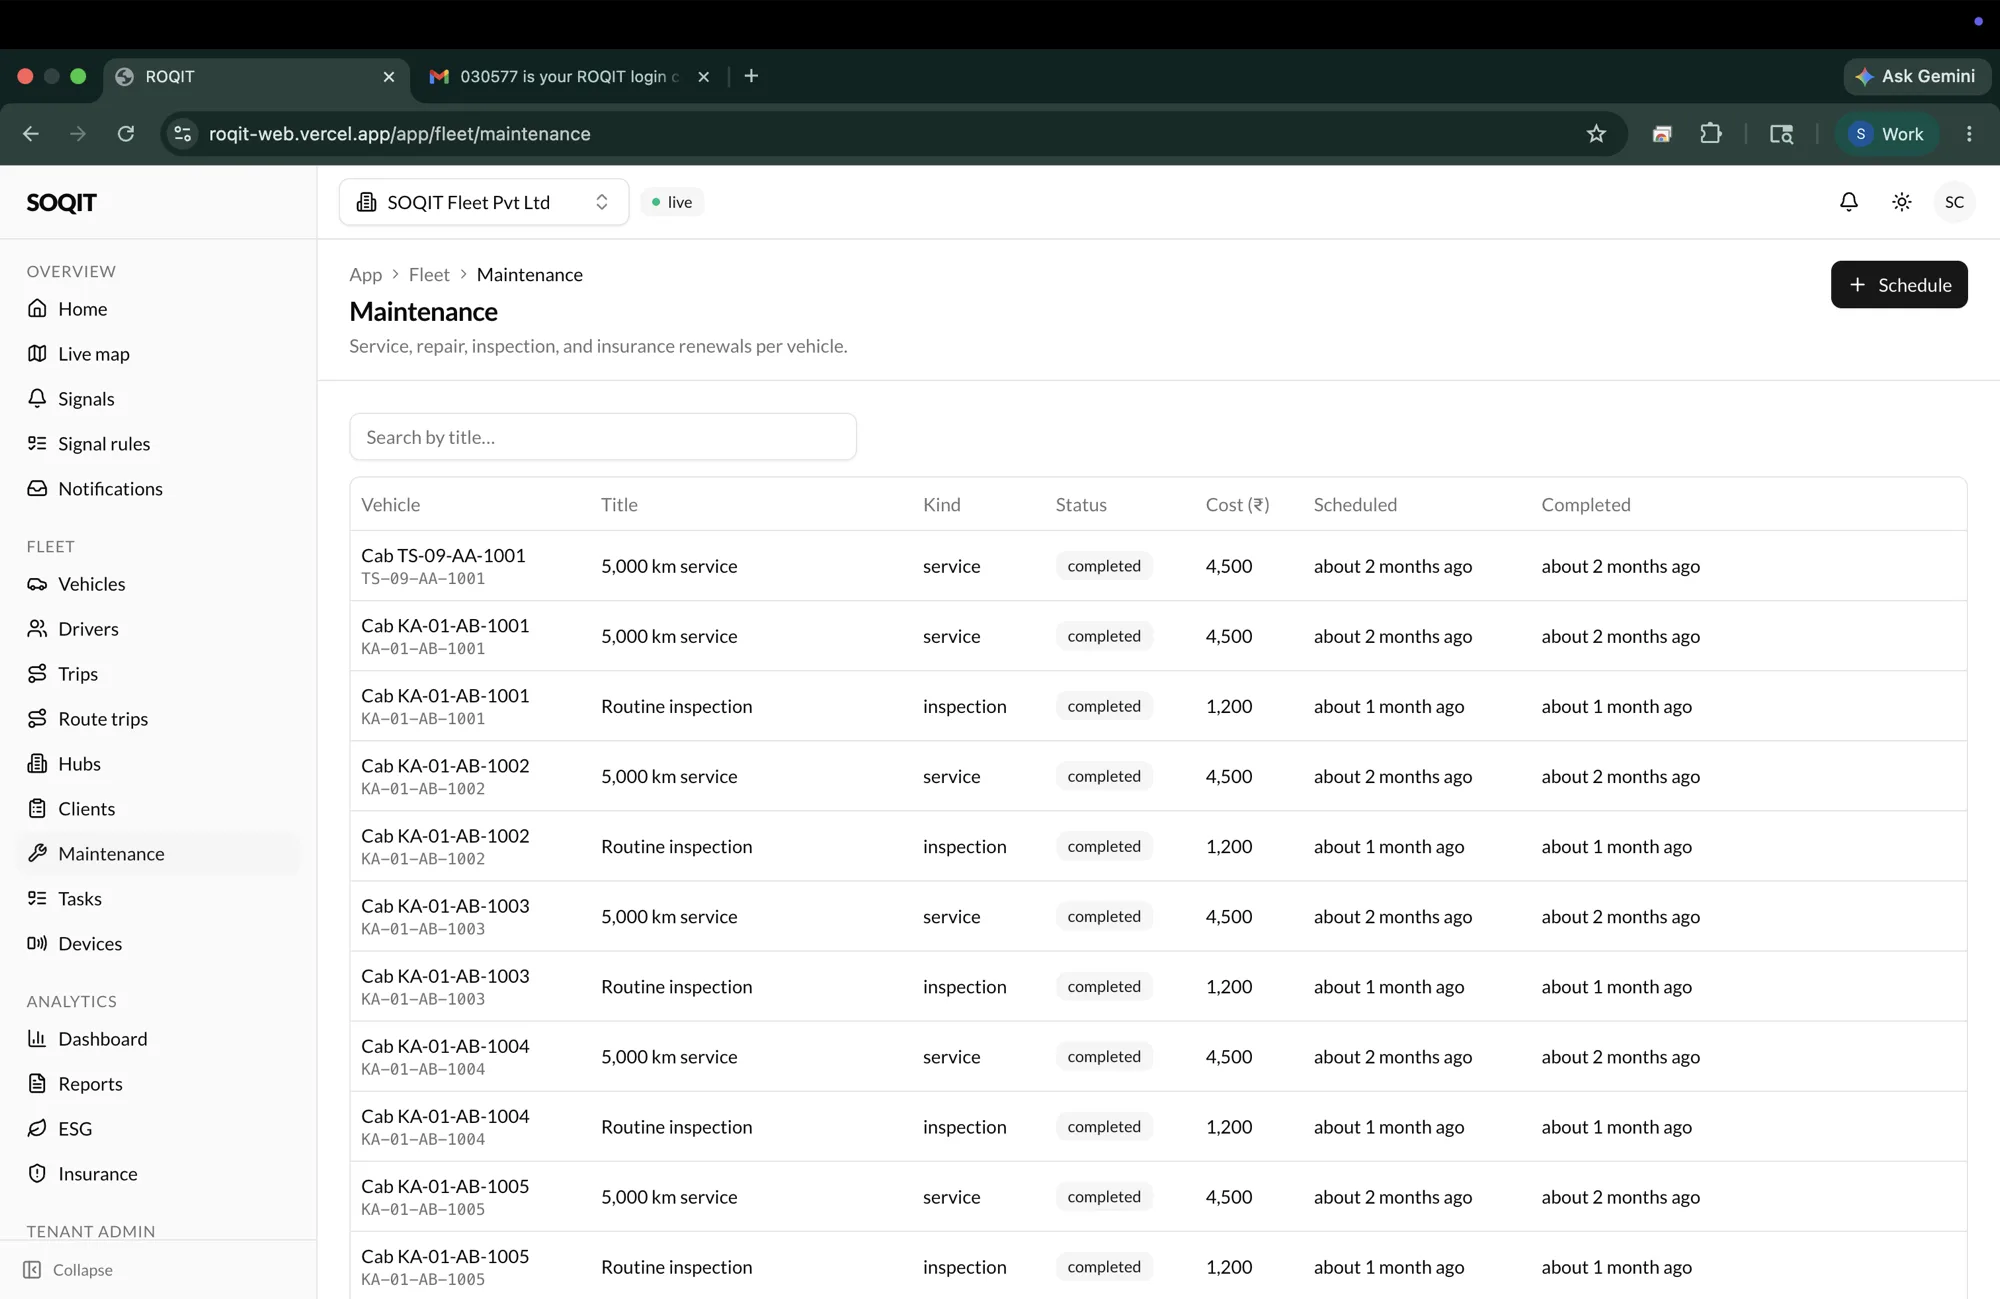
10 — Maintenance
Service, before it's a breakdown
Maintenance keeps the service, repair, inspection, and insurance-renewal history per vehicle, with cost and schedule. Routine inspections and big services sit in one timeline, so upkeep is planned against the calendar rather than remembered after something fails. The unglamorous half of fleet operations, made legible.
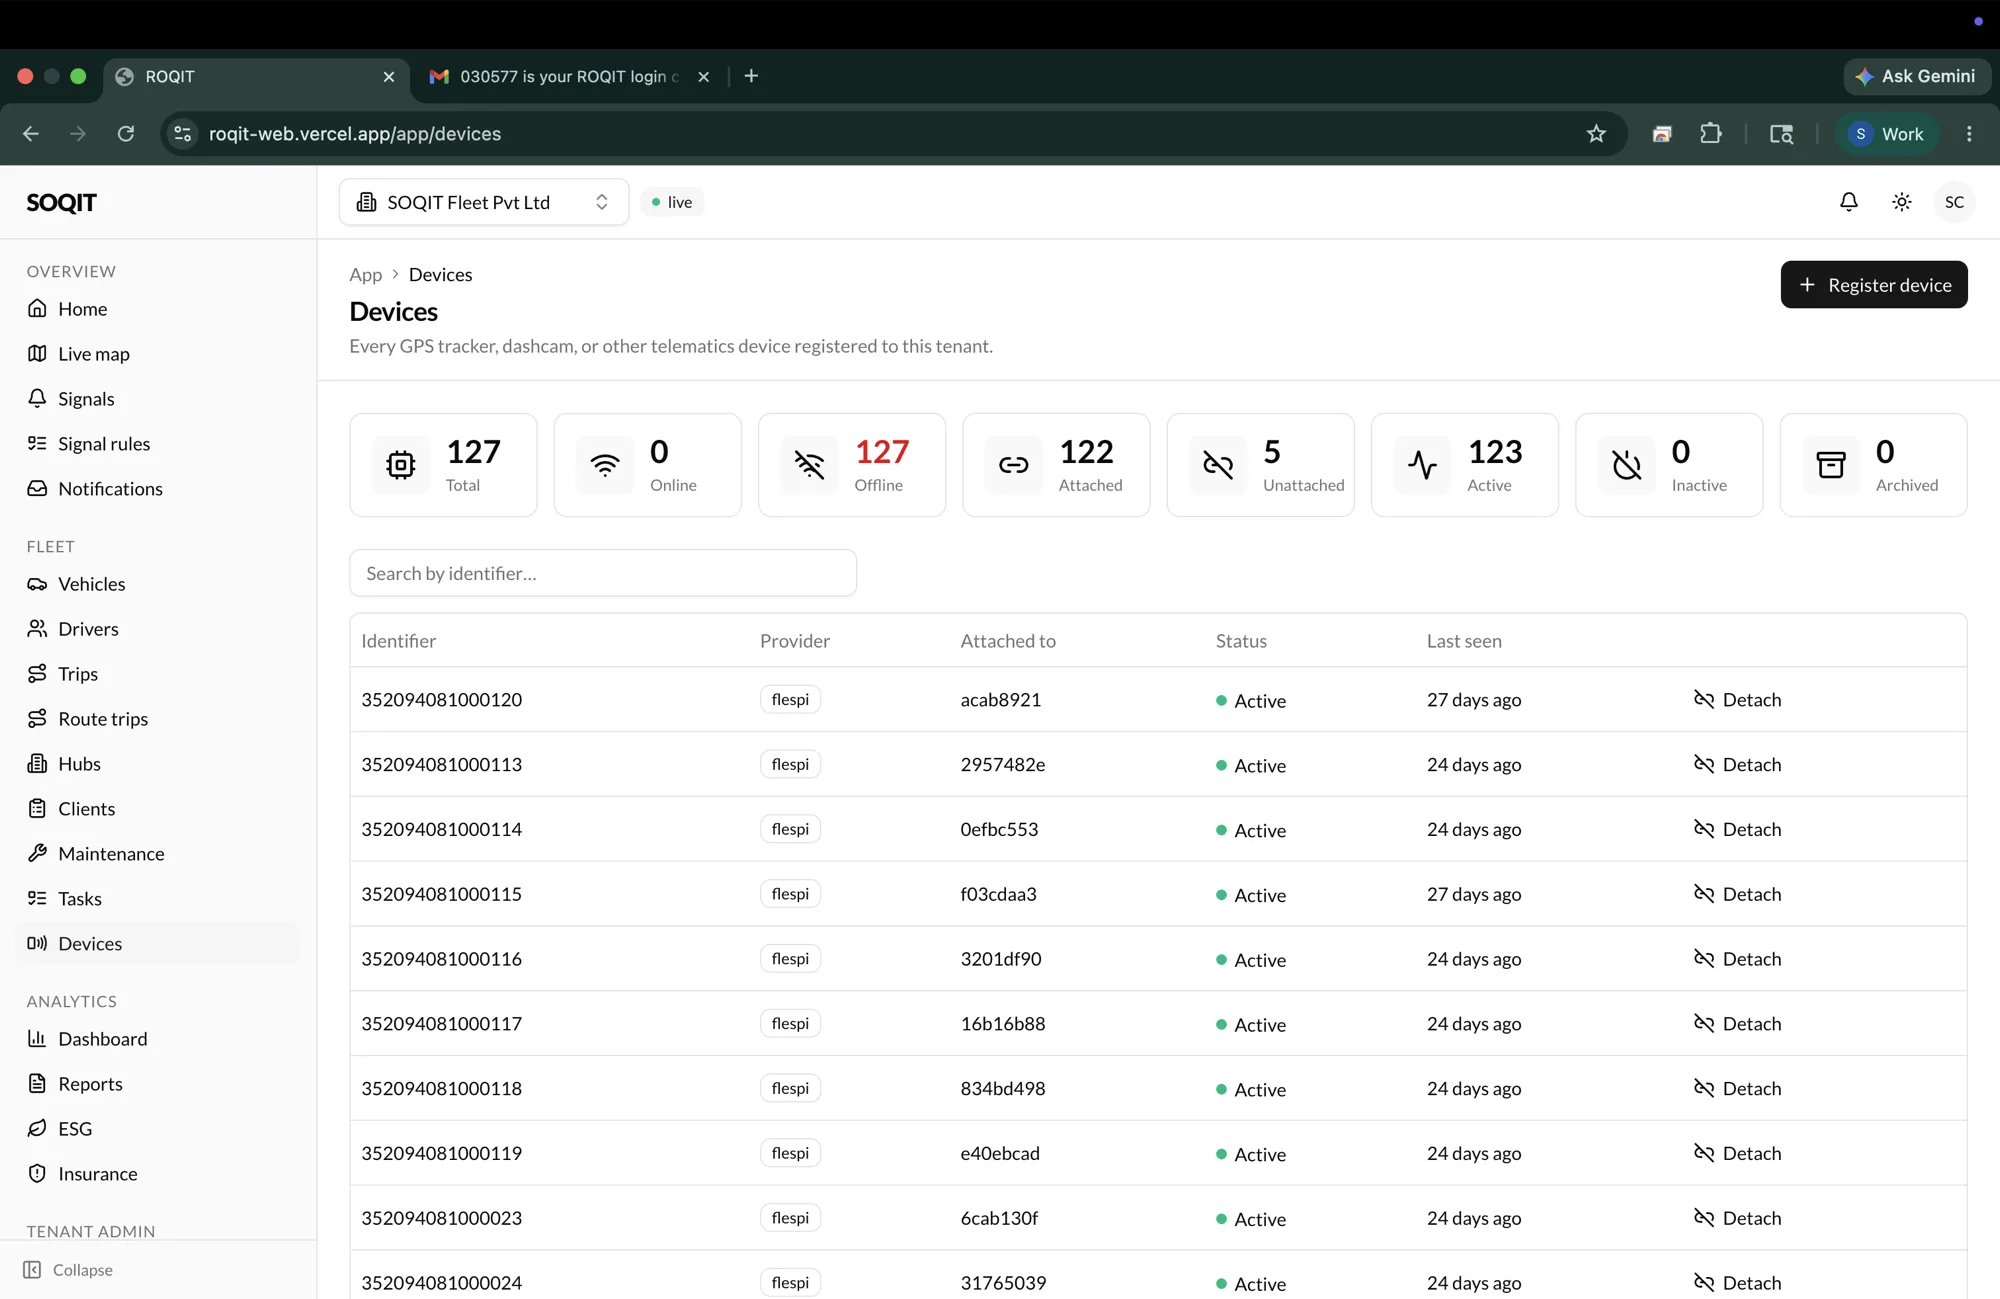
11 — Devices
The hardware behind the data
Every GPS tracker, dashcam, and telematics device registered to the tenant lives here, with its identifier, what it is attached to, and whether it is online. Online, offline, attached, and unattached counts make a silent device obvious, because the whole platform is only as honest as the hardware feeding it.
12 — Analytics
The operation, in numbers
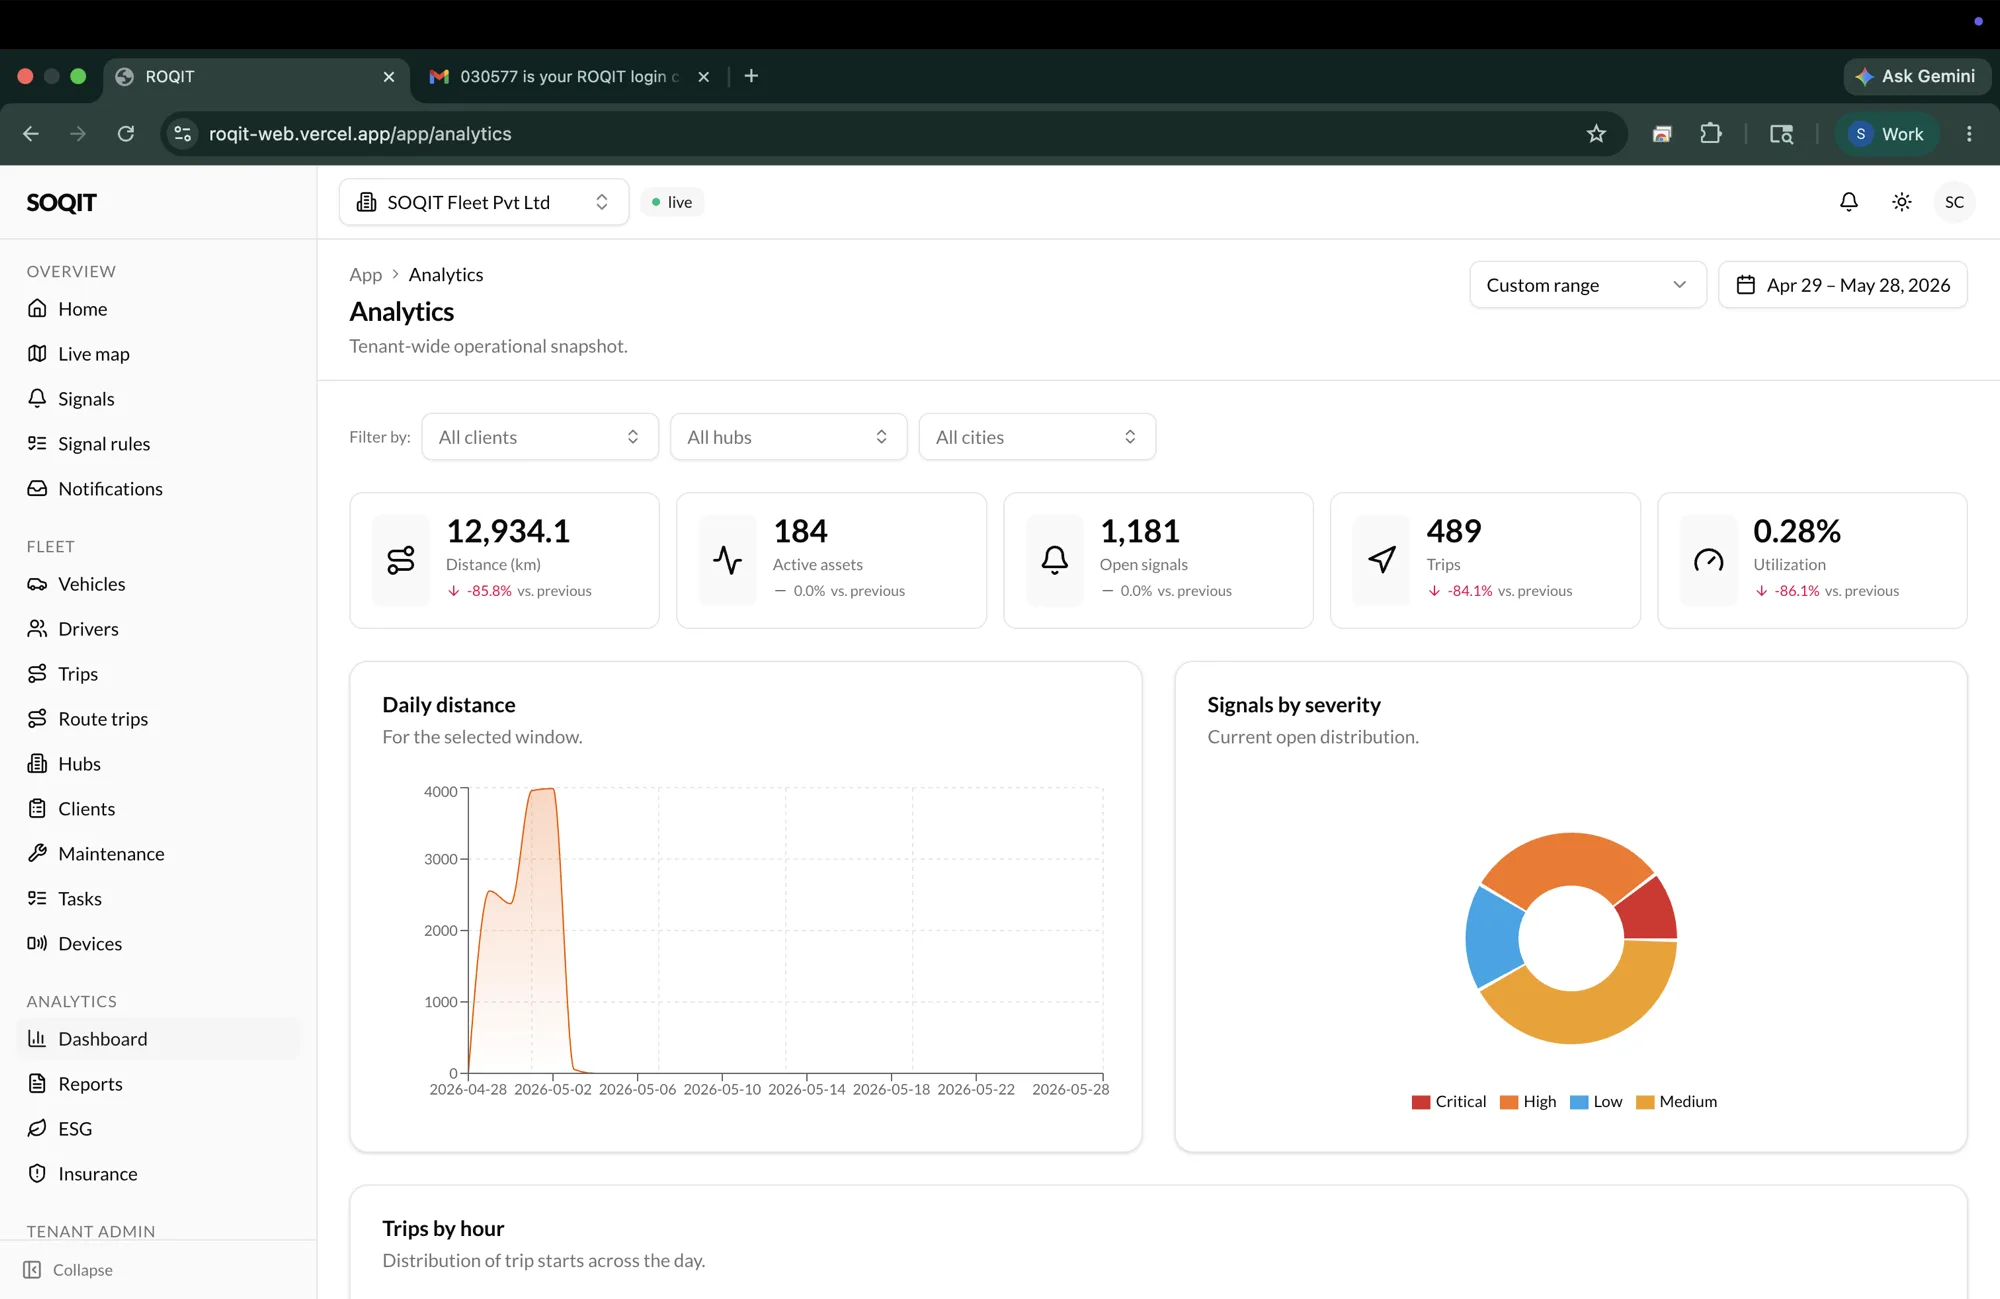
The analytics dashboard is the tenant-wide snapshot: distance covered, active assets, open signals, trips, and utilization, each against the previous window, with daily distance and the open-signal mix as quiet charts. The read is fast because the heavy aggregates are precomputed off the telemetry, not queried live on every load.
13 — Reports
Filtered, dated, exportable
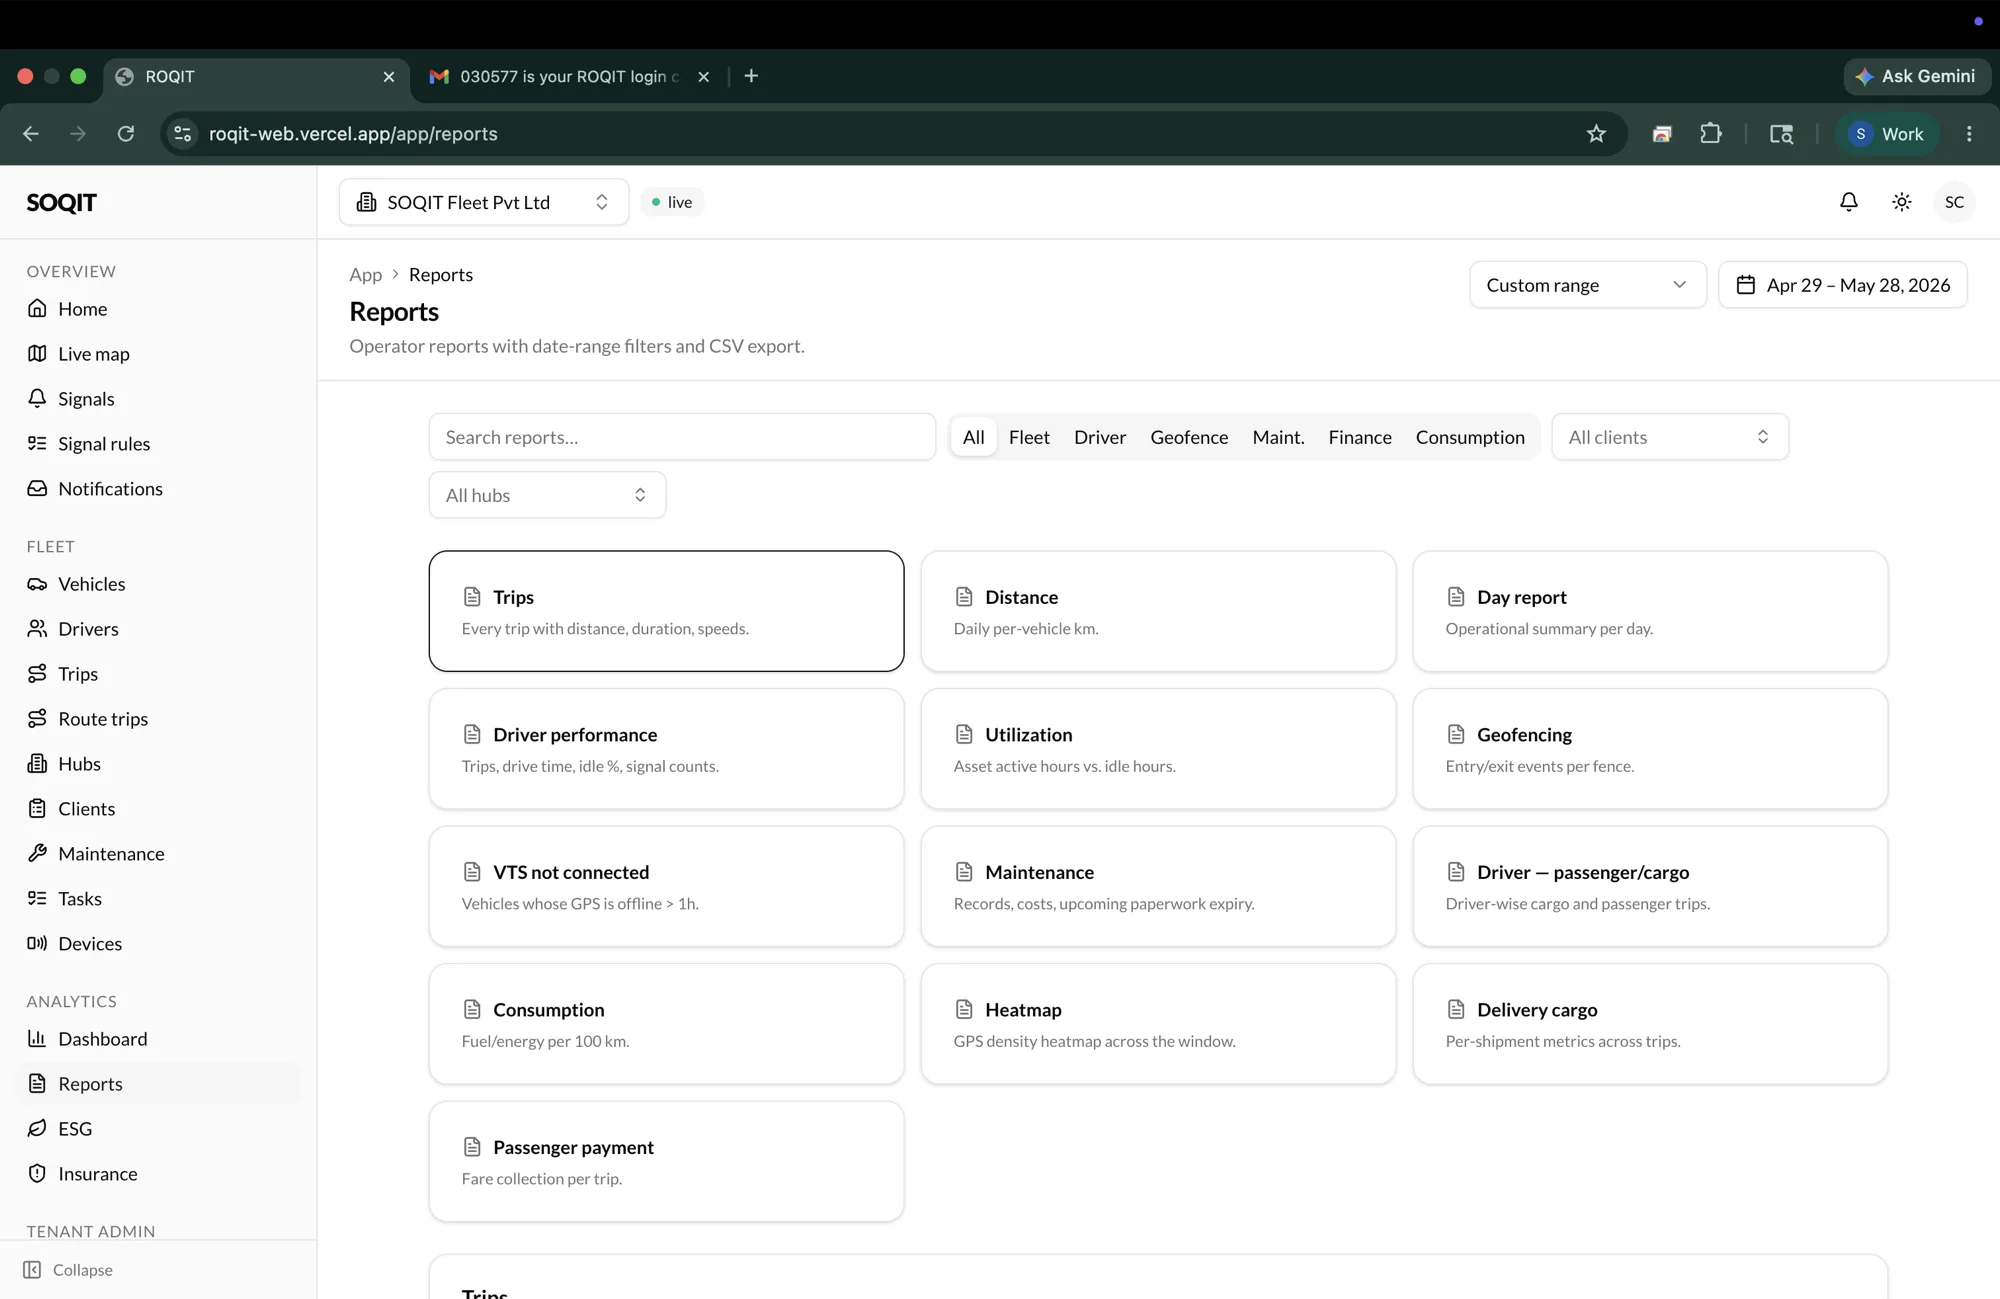
Reports is the catalogue operators actually run: trips, distance, driver performance, geofencing, maintenance, consumption, and more. Each takes a date range and a filter and exports to CSV, so the number a manager needs for a meeting is a couple of clicks, not a request to the engineering team.
14 — ESG
From kilometres to carbon
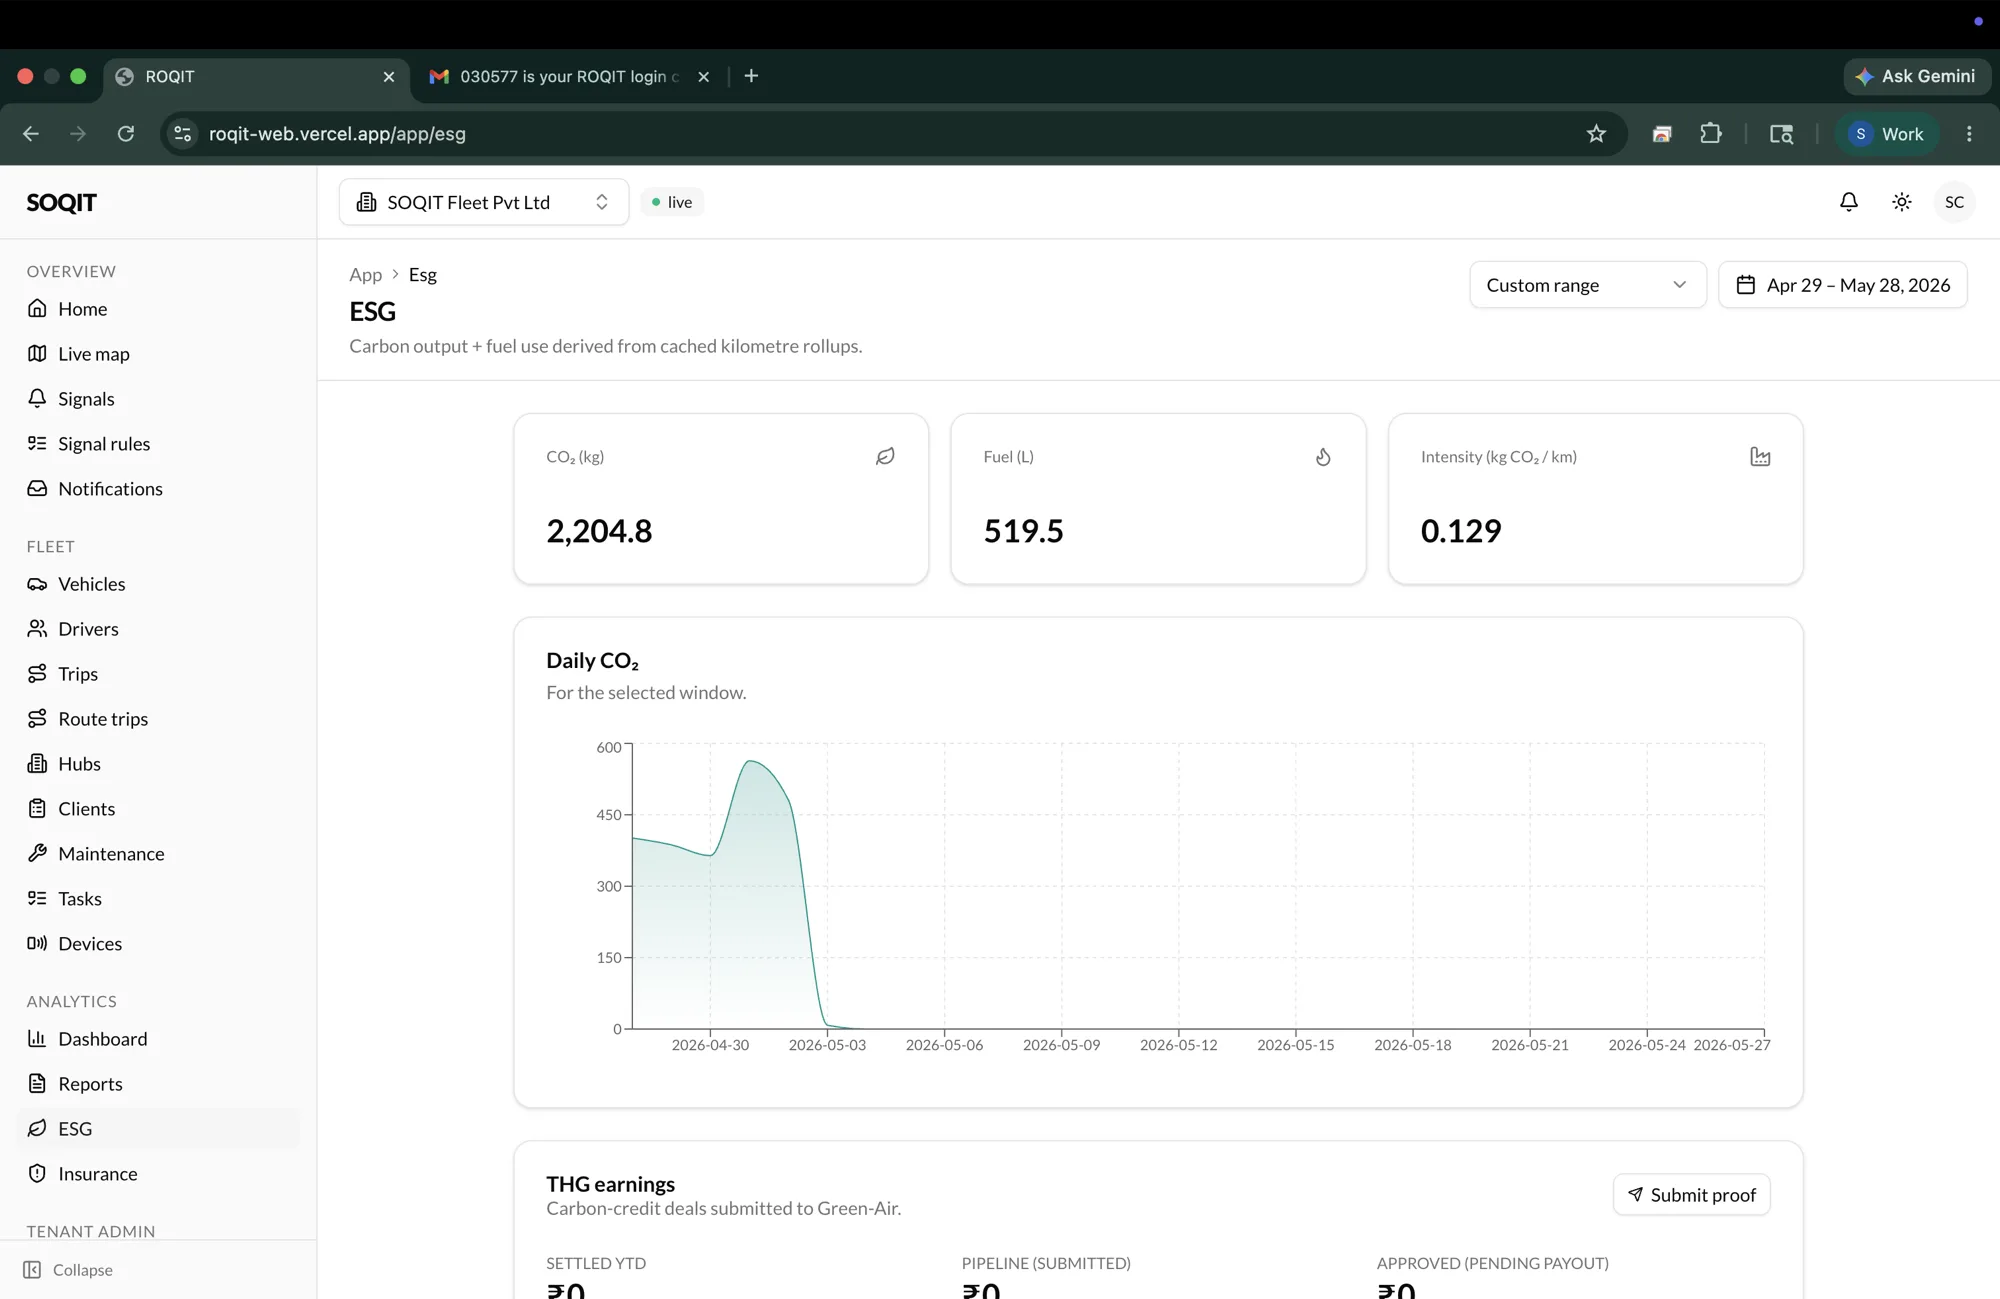
The same telemetry that drives operations feeds environmental reporting. ESG derives carbon output and fuel use from cached kilometre rollups, with CO2, fuel, and intensity over a window, and tracks carbon-credit earnings through their pipeline. Compliance reporting falls out of the data already being collected, not a separate project.
What we built
The tenant product UI
The per-customer surface: the live map, fleet, signals, geofences, analytics, and reports, scoped to that tenant's assets and people.
The admin console
The platform team's control plane: tenants, entitlements, audit, and support impersonation, in a separate route group of the same app.
The signals engine
A declarative rules engine that evaluates the live telemetry stream, ships presets, and lets each tenant tune them without touching code.
Live telemetry & the map
A streaming pipeline that ingests device data and pushes it to a real-time map, current to the second across many connected clients.
Analytics, reporting & ESG
Dashboards, a custom chart builder, scheduled reports, and environmental reporting, all reading off precomputed aggregates.
The integrations layer
Inbound adapters for telematics device feeds and OEM data, plus outbound webhooks so a tenant can wire Soqit into its own systems.
The backend is a Fastify monorepo split into three services. A gateway serves the REST and WebSocket API. An ingest service receives telemetry over MQTT and HTTP webhooks. A worker pool runs the asynchronous jobs on BullMQ and Redis. They share a single Postgres database through Drizzle, with the high-volume sensor readings kept in a TimescaleDB hypertable so time-series queries stay fast as the data grows.
Multi-tenancy is enforced at the lowest level we can reach: Postgres row-level security, so a query simply cannot return another tenant's rows. On top of that sits a manifest-driven pack system. A vertical declares its asset types, its signal presets, and its dashboard widgets as configuration, and the platform reads that manifest rather than hard-coding the vertical. Realtime fans out through Socket.io with a Redis adapter, so updates reach every connected client even when the API runs across several instances. Auth is session and OTP based, files live in S3-compatible storage, the API is documented through Swagger, and logging runs through Pino with PII redaction. Data-protection requests, deletion and audit, are first-class.
The web app is Next.js on the App Router, with the admin and tenant surfaces as separate route groups and host-based routing resolving which tenant a request belongs to. It's built on shadcn and Tailwind, with TanStack Query against the API, MapLibre for the map, and Recharts for the analytics. The interface is deliberately quiet: a near-monochrome palette where colour is reserved for data, hairline borders, and tabular figures. The API runs on Railway, the web app on Vercel.
The hard parts
Tenant isolation in the database
Postgres row-level security so isolation is a property of the data, not a filter the application has to remember to add on every query.
The signals rules engine
Evaluating declarative rules against a live stream, over both single readings and time windows, with presets a tenant can tune safely.
High-volume telemetry ingest
Taking device data over MQTT and webhooks into queues and a hypertable, fast enough to keep the map live and cheap enough to keep forever.
Manifest-driven packs
Treating each vertical as configuration, asset types, presets, and widgets declared in a manifest, so a new domain ships without forking the platform.
Realtime across instances
Fanning live updates out to every connected client through a Redis-backed socket layer, correct even when the API scales horizontally.
Privacy & data protection
PII redaction in the logs, a full audit trail, and first-class deletion so data-protection requests are a feature, not a fire drill.
One family does the whole platform. Lato, from a light display weight to a heavy one for emphasis, keeps a dense operational interface calm and legible.
- LatoEverything — display, UI, and data
A near-monochrome interface where colour is reserved for data. The greys carry the structure; the data palette carries the meaning; one red flags what's wrong. Colours are authored in OKLch; the hexes below are the closest sRGB read.
- InkText and the darkest UI. The interface reads as type on paper, not as colour.#1F1F1F
- PaperThe base surface. Dense tables and charts sit on plenty of white.#FFFFFF
- Mid greySecondary text, labels, and muted UI. The quiet half of the hierarchy.#8A8A8A
- HairlineBorders and dividers. One-pixel lines do the structural work instead of fills.#E5E5E5
- Data slateThe lead of the chart palette, joined by teal, amber, and yellow to separate series.#3A5A78
- Alert redThe one loud colour. Breached signals, errors, and destructive actions, never decoration.#E0382B